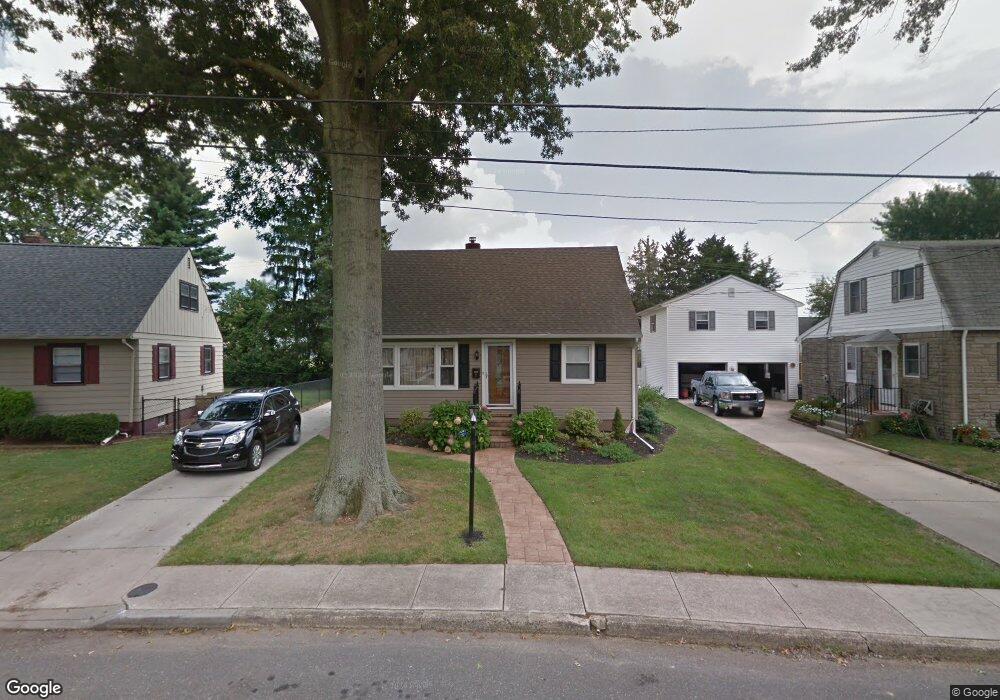
11 Colson Ct Woodstown, NJ 08098
Estimated Value: $213,143 - $329,000
--
Bed
--
Bath
960
Sq Ft
$285/Sq Ft
Est. Value
About This Home
This home is located at 11 Colson Ct, Woodstown, NJ 08098 and is currently estimated at $274,036, approximately $285 per square foot. 11 Colson Ct is a home located in Salem County with nearby schools including Mary S. Shoemaker School and Woodstown High School.
Ownership History
Date
Name
Owned For
Owner Type
Purchase Details
Closed on
Sep 15, 2005
Sold by
Layman Donald and Layman Janet L
Bought by
Moore Michelle Y
Current Estimated Value
Home Financials for this Owner
Home Financials are based on the most recent Mortgage that was taken out on this home.
Original Mortgage
$31,000
Outstanding Balance
$16,760
Interest Rate
5.92%
Mortgage Type
Credit Line Revolving
Estimated Equity
$257,276
Purchase Details
Closed on
Jun 3, 2005
Sold by
Layman Janet
Bought by
Layman Donald and Layman Janet L
Create a Home Valuation Report for This Property
The Home Valuation Report is an in-depth analysis detailing your home's value as well as a comparison with similar homes in the area
Home Values in the Area
Average Home Value in this Area
Purchase History
| Date | Buyer | Sale Price | Title Company |
|---|---|---|---|
| Moore Michelle Y | $155,000 | West Jersey Title Agency | |
| Layman Donald | $140,000 | West Jersey Title Agency |
Source: Public Records
Mortgage History
| Date | Status | Borrower | Loan Amount |
|---|---|---|---|
| Open | Moore Michelle Y | $31,000 | |
| Open | Moore Michelle Y | $124,000 |
Source: Public Records
Tax History Compared to Growth
Tax History
| Year | Tax Paid | Tax Assessment Tax Assessment Total Assessment is a certain percentage of the fair market value that is determined by local assessors to be the total taxable value of land and additions on the property. | Land | Improvement |
|---|---|---|---|---|
| 2025 | $6,357 | $158,300 | $75,800 | $82,500 |
| 2024 | $6,278 | $158,300 | $75,800 | $82,500 |
| 2023 | $6,278 | $158,300 | $75,800 | $82,500 |
| 2022 | $6,185 | $158,300 | $75,800 | $82,500 |
| 2021 | $6,053 | $158,300 | $75,800 | $82,500 |
| 2020 | $5,919 | $158,300 | $75,800 | $82,500 |
| 2019 | $5,696 | $158,300 | $75,800 | $82,500 |
| 2018 | $5,491 | $158,300 | $75,800 | $82,500 |
| 2017 | $5,374 | $158,300 | $75,800 | $82,500 |
| 2016 | $5,206 | $158,300 | $75,800 | $82,500 |
| 2015 | $4,844 | $158,300 | $75,800 | $82,500 |
| 2014 | $4,594 | $156,000 | $75,800 | $80,200 |
Source: Public Records
Map
Nearby Homes
- 50 Colson Ct
- 15 E Grant St
- 36 Bowen Ave
- L13 Highway 40 W
- 47 Dickinson St
- 8 Eichmann Way
- 35 Green St
- 39 Green St
- 76 West Ave
- 133 Spring Garden St
- 73 Kingsberry Ln
- 29 Kingsberry Ln
- 96 Kingsberry Ln
- 178 E Millbrooke Ave
- 64 W Millbrooke Ave
- 444 S Main St
- 13 Alloway Rd
- 236 E Lake Rd
- 22 Alloway Rd
- 438 Bailey St