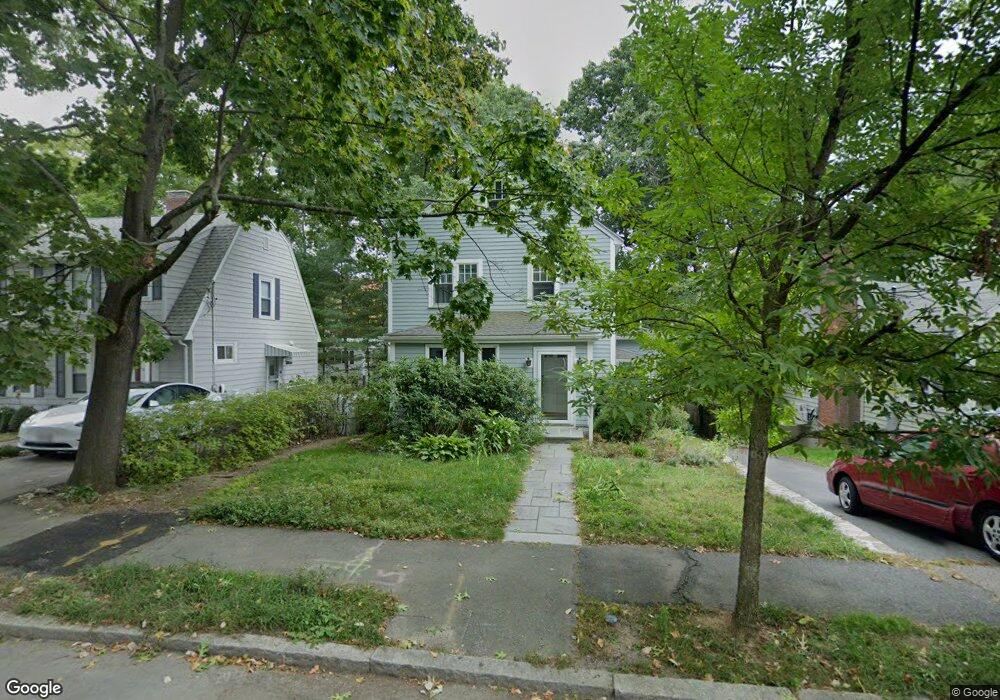
11 Conant Rd Chestnut Hill, MA 02467
South Brookline NeighborhoodEstimated Value: $1,271,000 - $1,518,000
About This Home
This home is located at 11 Conant Rd, Chestnut Hill, MA 02467 and is currently estimated at $1,391,066, approximately $778 per square foot. 11 Conant Rd is a home located in Norfolk County with nearby schools including Baker School, Brookline High School, and Holy Name Parish School.
Ownership History
We collect this data history from publicly available records. To have your information removed, we recommend requesting removal directly through your county’s website.
Purchase Details
Home Financials for this Owner
Home Financials are based on the most recent Mortgage that was taken out on this home.Home Values in the Area
Average Home Value in this Area
Purchase History
We collect this data history from publicly available records. To have your information removed, we recommend requesting removal directly through your county’s website.
| Date | Buyer | Sale Price | Title Company |
|---|---|---|---|
| $230,000 | -- |
Mortgage History
We collect this data history from publicly available records. To have your information removed, we recommend requesting removal directly through your county’s website.
| Date | Status | Borrower | Loan Amount |
|---|---|---|---|
| Open | $144,000 | ||
| Closed | $160,000 | ||
| Previous Owner | $120,000 |
Tax History
We collect this data history from publicly available records. To have your information removed, we recommend requesting removal directly through your county’s website.
| Year | Tax Paid | Tax Assessment Tax Assessment Total Assessment is a certain percentage of the fair market value that is determined by local assessors to be the total taxable value of land and additions on the property. | Land | Improvement |
|---|---|---|---|---|
| 2025 | $12,322 | $1,248,400 | $609,100 | $639,300 |
| 2024 | $11,720 | $1,199,600 | $585,600 | $614,000 |
| 2023 | $10,742 | $1,077,400 | $474,900 | $602,500 |
| 2022 | $10,456 | $1,026,100 | $452,300 | $573,800 |
| 2021 | $9,670 | $986,700 | $434,900 | $551,800 |
| 2020 | $8,874 | $939,100 | $395,300 | $543,800 |
| 2019 | $8,381 | $894,400 | $376,500 | $517,900 |
| 2018 | $8,400 | $887,900 | $376,500 | $511,400 |
| 2017 | $8,275 | $837,600 | $355,100 | $482,500 |
| 2016 | $8,157 | $782,800 | $331,900 | $450,900 |
| 2015 | $6,315 | $591,300 | $310,200 | $281,100 |
| 2014 | $6,284 | $551,700 | $282,100 | $269,600 |
Map
- 202 Allandale Rd Unit B
- 232 Allandale Rd Unit 1C
- 232 Allandale Rd Unit 3A
- 87 Payson Rd
- 214 Allandale Rd Unit B
- 214 Allandale Rd Unit D
- 11 Crehore Rd
- 71 Grove St
- 17 Fairgreen Place
- 367 Newton St
- 25 Clearwater Rd
- 109 Whitcomb Ave
- 191 Newton St
- 136 Weld St
- 11 Whitney St Unit 11
- 303 Russett Rd
- 30 Allandale St
- 16 Ravenna Rd
- 11 Colby Rd
- 8 Carlson Cir
Ask me questions while you tour the home.