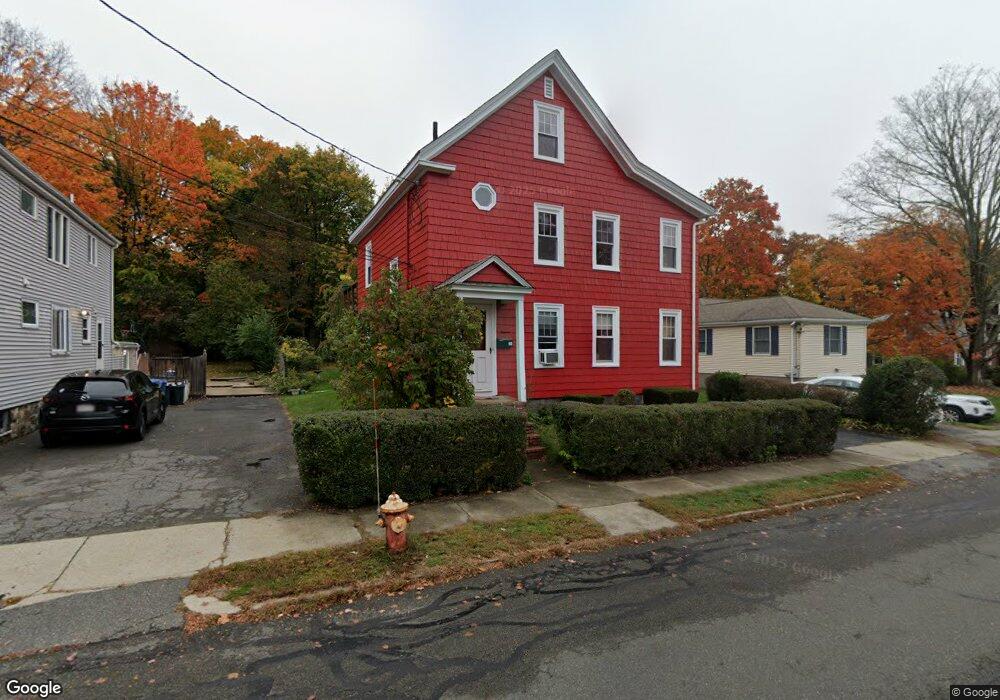
11 Converse St Wakefield, MA 01880
West Side NeighborhoodEstimated Value: $832,000 - $1,194,000
5
Beds
2
Baths
2,250
Sq Ft
$427/Sq Ft
Est. Value
About This Home
This home is located at 11 Converse St, Wakefield, MA 01880 and is currently estimated at $961,658, approximately $427 per square foot. 11 Converse St is a home located in Middlesex County with nearby schools including Wakefield Memorial High School, St Joseph School, and St. Patrick Elementary School.
Ownership History
Date
Name
Owned For
Owner Type
Purchase Details
Closed on
May 28, 2009
Sold by
Ackerman Heidi
Bought by
Faw Heidi
Current Estimated Value
Home Financials for this Owner
Home Financials are based on the most recent Mortgage that was taken out on this home.
Original Mortgage
$180,000
Outstanding Balance
$114,339
Interest Rate
4.87%
Estimated Equity
$847,319
Purchase Details
Closed on
Jun 15, 1994
Sold by
Perosa Richard U and Perosa Cynthia L
Bought by
Ackerman Paul J and Ackerman Heidi
Purchase Details
Closed on
Apr 1, 1992
Sold by
Dorrance Stephen and Dorrance Rosamond
Bought by
Perosa Richard U and Body Cynthia L
Purchase Details
Closed on
Jan 2, 1987
Sold by
Keating Wm H
Bought by
Dorrance Stephen
Create a Home Valuation Report for This Property
The Home Valuation Report is an in-depth analysis detailing your home's value as well as a comparison with similar homes in the area
Home Values in the Area
Average Home Value in this Area
Purchase History
| Date | Buyer | Sale Price | Title Company |
|---|---|---|---|
| Faw Heidi | -- | -- | |
| Ackerman Paul J | $200,000 | -- | |
| Perosa Richard U | $203,000 | -- | |
| Dorrance Stephen | $170,000 | -- |
Source: Public Records
Mortgage History
| Date | Status | Borrower | Loan Amount |
|---|---|---|---|
| Open | Dorrance Stephen | $180,000 | |
| Previous Owner | Dorrance Stephen | $165,000 | |
| Previous Owner | Dorrance Stephen | $151,500 |
Source: Public Records
Tax History
| Year | Tax Paid | Tax Assessment Tax Assessment Total Assessment is a certain percentage of the fair market value that is determined by local assessors to be the total taxable value of land and additions on the property. | Land | Improvement |
|---|---|---|---|---|
| 2025 | $8,703 | $766,800 | $369,200 | $397,600 |
| 2024 | $8,576 | $762,300 | $367,000 | $395,300 |
| 2023 | $8,155 | $695,200 | $334,700 | $360,500 |
| 2022 | $7,800 | $633,100 | $304,800 | $328,300 |
| 2021 | $7,363 | $578,400 | $284,200 | $294,200 |
| 2020 | $6,905 | $540,700 | $265,700 | $275,000 |
| 2019 | $6,596 | $514,100 | $252,600 | $261,500 |
| 2018 | $6,141 | $474,200 | $233,000 | $241,200 |
| 2017 | $5,775 | $443,200 | $217,700 | $225,500 |
| 2016 | $5,403 | $400,500 | $206,000 | $194,500 |
| 2015 | $5,046 | $374,300 | $192,500 | $181,800 |
| 2014 | $4,600 | $359,900 | $185,100 | $174,800 |
Source: Public Records
Map
Nearby Homes
- 4 Adams St
- 55 Bartley St
- 248 Albion St Unit 231
- 248 Albion St Unit 321
- 252 Albion St Unit 3
- 95 Prospect St
- 69 Foundry St Unit 310
- 69 Foundry St Unit 416
- 62 Foundry St Unit 204
- 62 Foundry St Unit 402
- 62 Foundry St Unit 414
- 62 Foundry St Unit 210
- 62 High St Unit Lot 8
- 62 High St Unit 4
- 62 High St Unit Lot 5
- 62 High St Unit Lot 12
- 3 Valley Rd
- 43-45 Crescent St
- 64 Main St Unit 24B
- 66 Main St Unit 16A
Your Personal Tour Guide
Ask me questions while you tour the home.