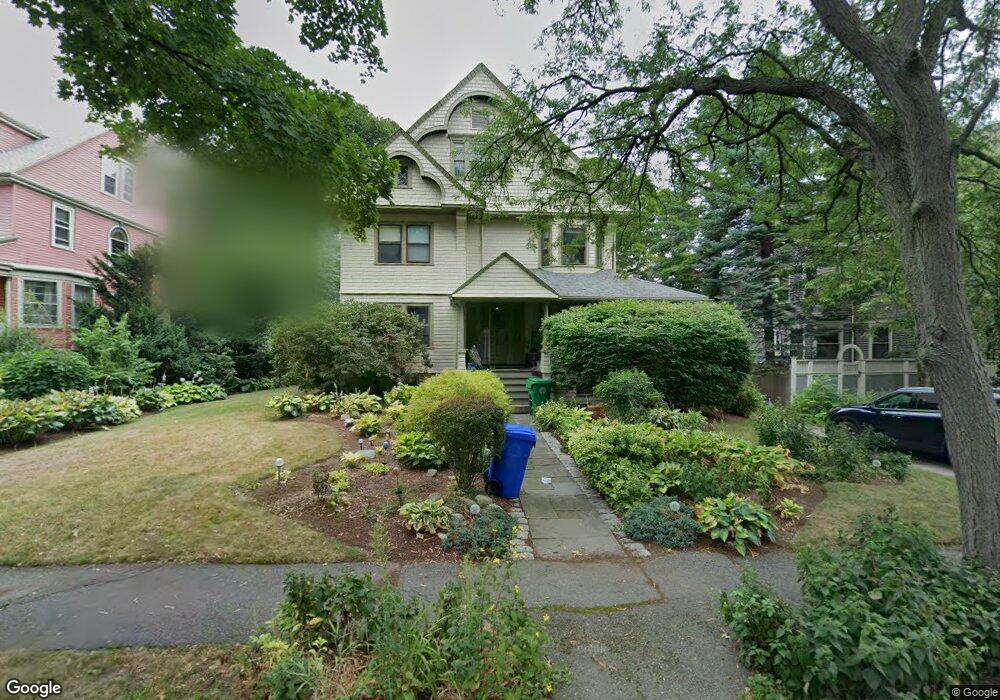
11 Copley St Newton, MA 02458
Newton Corner NeighborhoodEstimated Value: $1,955,174 - $2,144,000
5
Beds
3
Baths
3,447
Sq Ft
$592/Sq Ft
Est. Value
About This Home
This home is located at 11 Copley St, Newton, MA 02458 and is currently estimated at $2,042,294, approximately $592 per square foot. 11 Copley St is a home located in Middlesex County with nearby schools including Underwood Elementary School, Bigelow Middle School, and Newton North High School.
Ownership History
Date
Name
Owned For
Owner Type
Purchase Details
Closed on
Jun 29, 2020
Sold by
Higgins Wallace E
Bought by
Wallace E Higgins Lt
Current Estimated Value
Create a Home Valuation Report for This Property
The Home Valuation Report is an in-depth analysis detailing your home's value as well as a comparison with similar homes in the area
Home Values in the Area
Average Home Value in this Area
Purchase History
| Date | Buyer | Sale Price | Title Company |
|---|---|---|---|
| Wallace E Higgins Lt | -- | None Available |
Source: Public Records
Tax History Compared to Growth
Tax History
| Year | Tax Paid | Tax Assessment Tax Assessment Total Assessment is a certain percentage of the fair market value that is determined by local assessors to be the total taxable value of land and additions on the property. | Land | Improvement |
|---|---|---|---|---|
| 2025 | $16,515 | $1,685,200 | $1,045,900 | $639,300 |
| 2024 | $15,968 | $1,636,100 | $1,015,400 | $620,700 |
| 2023 | $15,142 | $1,487,400 | $778,900 | $708,500 |
| 2022 | $14,488 | $1,377,200 | $721,200 | $656,000 |
| 2021 | $13,979 | $1,299,200 | $680,400 | $618,800 |
| 2020 | $13,564 | $1,299,200 | $680,400 | $618,800 |
| 2019 | $13,182 | $1,261,400 | $660,600 | $600,800 |
| 2018 | $12,547 | $1,159,600 | $596,700 | $562,900 |
| 2017 | $12,165 | $1,094,000 | $562,900 | $531,100 |
| 2016 | $11,635 | $1,022,400 | $526,100 | $496,300 |
| 2015 | $11,093 | $955,500 | $491,700 | $463,800 |
Source: Public Records
Map
Nearby Homes
- 70 Washington St Unit 70
- 70 Washington St
- 180 Hunnewell Ave Unit 180
- 159 Washington St Unit 4
- 4 Remick Terrace
- 4 Remick Terrace Unit 4
- 65-67 Saint James Cir
- 69 Presentation Rd
- 68 Vernon St
- 121 Tremont St Unit B1
- 99 Tremont St Unit 105
- 99 Tremont St Unit 413
- 9 Baldwin St Unit 15C
- 8 Tremont Place
- 39 Champney St
- 10 Williams St Unit 39
- 10 Williams St Unit 56
- 164 Galen St Unit 88
- 164 Galen St Unit 65
- 106 Farlow Rd
- 5 Copley St
- 17 Copley St
- 98 Hunnewell Ave
- 102 Hunnewell Ave
- 12 Copley St
- 18 Copley St
- 25 Copley St
- 10 Linder Terrace
- 4 Copley St
- 108 Hunnewell Ave
- 28 Copley St
- 16 Linder Terrace
- 16 Linder Terrace Unit 16 Linder
- 16 Linder Terrace Unit ID1238012P
- 16 Linder Terrace Unit 1
- 16 Linder Terrace Unit 2
- 91 Hunnewell Ave
- 33 Copley St
- 111 Grasmere St
- 115 Grasmere St