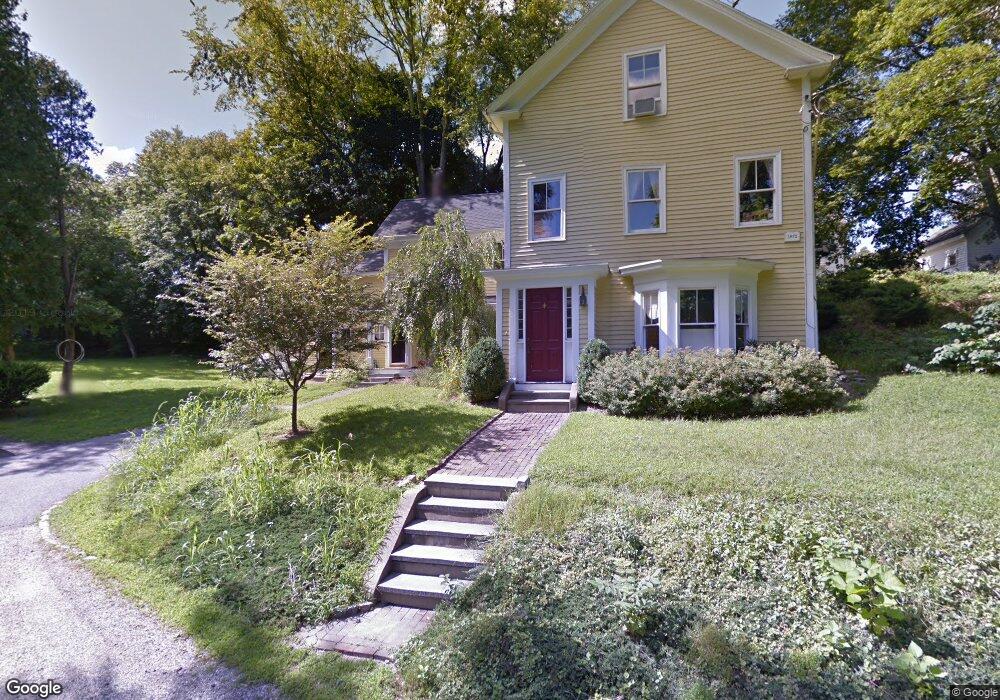
11 Cormans Ln Wayland, MA 01778
Estimated Value: $1,118,000 - $1,304,000
4
Beds
3
Baths
2,500
Sq Ft
$480/Sq Ft
Est. Value
About This Home
This home is located at 11 Cormans Ln, Wayland, MA 01778 and is currently estimated at $1,199,193, approximately $479 per square foot. 11 Cormans Ln is a home located in Middlesex County with nearby schools including Wayland High School, Christa McAuliffe Charter School, and Veritas Christian Academy.
Ownership History
Date
Name
Owned For
Owner Type
Purchase Details
Closed on
Jun 30, 2010
Sold by
Morgan William T and Morgan Katherine S
Bought by
Kilmon Randy and Kilmon Randolph Byrd
Current Estimated Value
Home Financials for this Owner
Home Financials are based on the most recent Mortgage that was taken out on this home.
Original Mortgage
$400,000
Outstanding Balance
$267,923
Interest Rate
4.88%
Mortgage Type
Purchase Money Mortgage
Estimated Equity
$931,270
Purchase Details
Closed on
Nov 21, 2008
Sold by
Ellis Brothers Prop Ll
Bought by
Morgan Katherine S and Morgan William T
Home Financials for this Owner
Home Financials are based on the most recent Mortgage that was taken out on this home.
Original Mortgage
$523,000
Interest Rate
6.03%
Mortgage Type
Purchase Money Mortgage
Purchase Details
Closed on
Sep 6, 2007
Sold by
Foley Helen F
Bought by
Ellis Brother Prop Llc
Home Financials for this Owner
Home Financials are based on the most recent Mortgage that was taken out on this home.
Original Mortgage
$383,500
Interest Rate
6.74%
Mortgage Type
Purchase Money Mortgage
Create a Home Valuation Report for This Property
The Home Valuation Report is an in-depth analysis detailing your home's value as well as a comparison with similar homes in the area
Home Values in the Area
Average Home Value in this Area
Purchase History
| Date | Buyer | Sale Price | Title Company |
|---|---|---|---|
| Kilmon Randy | $580,000 | -- | |
| Morgan Katherine S | $585,000 | -- | |
| Ellis Brother Prop Llc | $225,000 | -- | |
| Kilmon Randy | $580,000 | -- | |
| Morgan Katherine S | $585,000 | -- | |
| Ellis Brother Prop Llc | $225,000 | -- |
Source: Public Records
Mortgage History
| Date | Status | Borrower | Loan Amount |
|---|---|---|---|
| Open | Kilmon Randy | $400,000 | |
| Closed | Ellis Brother Prop Llc | $400,000 | |
| Previous Owner | Morgan Katherine S | $523,000 | |
| Previous Owner | Ellis Brother Prop Llc | $383,500 |
Source: Public Records
Tax History Compared to Growth
Tax History
| Year | Tax Paid | Tax Assessment Tax Assessment Total Assessment is a certain percentage of the fair market value that is determined by local assessors to be the total taxable value of land and additions on the property. | Land | Improvement |
|---|---|---|---|---|
| 2025 | $15,513 | $992,500 | $509,400 | $483,100 |
| 2024 | $14,691 | $946,600 | $485,200 | $461,400 |
| 2023 | $13,981 | $839,700 | $441,100 | $398,600 |
| 2022 | $13,841 | $754,300 | $365,400 | $388,900 |
| 2021 | $13,308 | $718,600 | $332,100 | $386,500 |
| 2020 | $12,547 | $706,500 | $332,100 | $374,400 |
| 2019 | $12,619 | $690,300 | $316,400 | $373,900 |
| 2018 | $5,990 | $668,600 | $316,400 | $352,200 |
| 2017 | $11,570 | $637,800 | $301,200 | $336,600 |
| 2016 | $10,869 | $626,800 | $295,400 | $331,400 |
| 2015 | $11,124 | $604,900 | $295,400 | $309,500 |
Source: Public Records
Map
Nearby Homes
- 131 Commonwealth Rd
- 131 Commonwealth Rd Unit 1
- 131 Commonwealth Rd Unit 2
- 9 Cormans Ln
- 127 Commonwealth Rd
- 135 Commonwealth Rd
- 123 Commonwealth Rd
- 136 Commonwealth Rd
- 128 Commonwealth Rd
- 119 Commonwealth Rd
- 124 Commonwealth Rd
- 120 Commonwealth Rd
- 117 Commonwealth Rd
- 118 Commonwealth Rd
- 5 Stanton St
- 78 Main St Unit 78
- 134 Commonwealth Rd
- 134 Commonwealth Rd Unit B
- 134 Commonwealth Rd Unit 1
- 134 Commonwealth Rd Unit 2