Estimated Value: $858,720 - $987,000
4
Beds
3
Baths
2,268
Sq Ft
$400/Sq Ft
Est. Value
About This Home
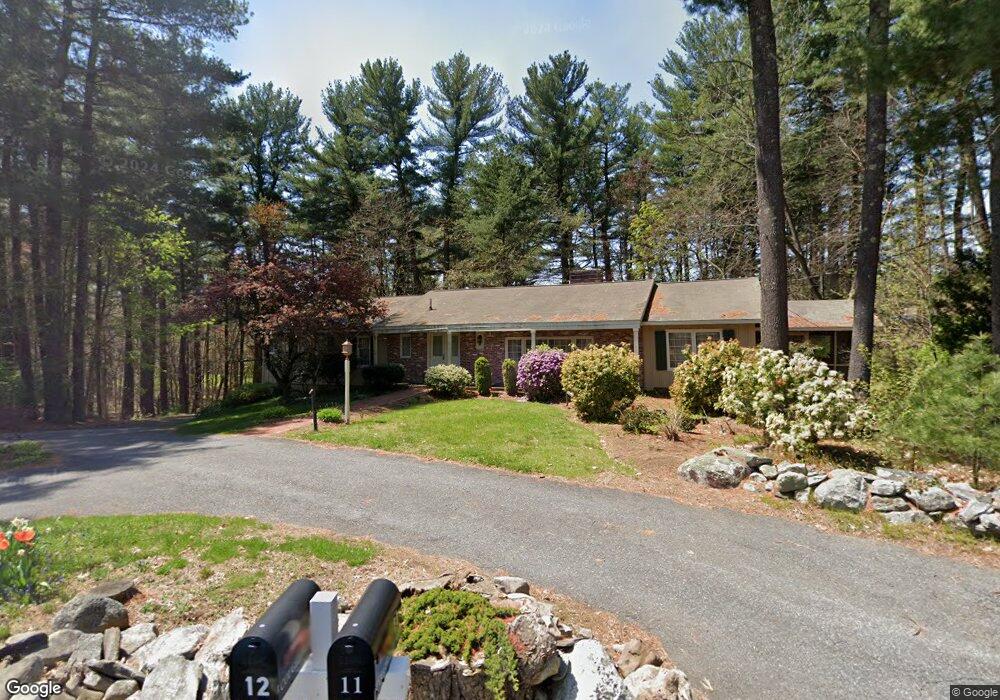
This home is located at 11 Coughlin St, Acton, MA 01720 and is currently estimated at $907,430, approximately $400 per square foot. 11 Coughlin St is a home located in Middlesex County with nearby schools including Acton-Boxborough Regional High School, Oak Meadow Montessori School, and The Imago School.
Ownership History
Date
Name
Owned For
Owner Type
Purchase Details
Closed on
Dec 2, 2022
Sold by
Papadopoulos Constantine and Papadopoulos Efimia
Bought by
Papadopoulos Iint C
Current Estimated Value
Purchase Details
Closed on
Feb 14, 1986
Bought by
Papadopoulos Constantine
Create a Home Valuation Report for This Property
The Home Valuation Report is an in-depth analysis detailing your home's value as well as a comparison with similar homes in the area
Home Values in the Area
Average Home Value in this Area
Purchase History
| Date | Buyer | Sale Price | Title Company |
|---|---|---|---|
| Papadopoulos Iint C | -- | None Available | |
| Papadopoulos Constantine | $275,000 | -- |
Source: Public Records
Mortgage History
| Date | Status | Borrower | Loan Amount |
|---|---|---|---|
| Previous Owner | Papadopoulos Constantine | $55,000 | |
| Previous Owner | Papadopoulos Constantine | $86,000 | |
| Previous Owner | Papadopoulos Constantine | $95,000 | |
| Previous Owner | Papadopoulos Constantine | $100,000 |
Source: Public Records
Tax History Compared to Growth
Tax History
| Year | Tax Paid | Tax Assessment Tax Assessment Total Assessment is a certain percentage of the fair market value that is determined by local assessors to be the total taxable value of land and additions on the property. | Land | Improvement |
|---|---|---|---|---|
| 2025 | $13,082 | $762,800 | $322,800 | $440,000 |
| 2024 | $12,381 | $742,700 | $322,800 | $419,900 |
| 2023 | $12,034 | $685,300 | $293,400 | $391,900 |
| 2022 | $12,045 | $619,300 | $255,100 | $364,200 |
| 2021 | $11,493 | $568,100 | $236,100 | $332,000 |
| 2020 | $10,751 | $558,800 | $236,100 | $322,700 |
| 2019 | $10,258 | $529,600 | $236,100 | $293,500 |
| 2018 | $9,450 | $487,600 | $236,100 | $251,500 |
| 2017 | $9,444 | $495,500 | $236,100 | $259,400 |
| 2016 | $8,788 | $457,000 | $236,100 | $220,900 |
| 2015 | $8,752 | $459,400 | $236,100 | $223,300 |
| 2014 | $8,749 | $449,800 | $236,100 | $213,700 |
Source: Public Records
Map
Nearby Homes