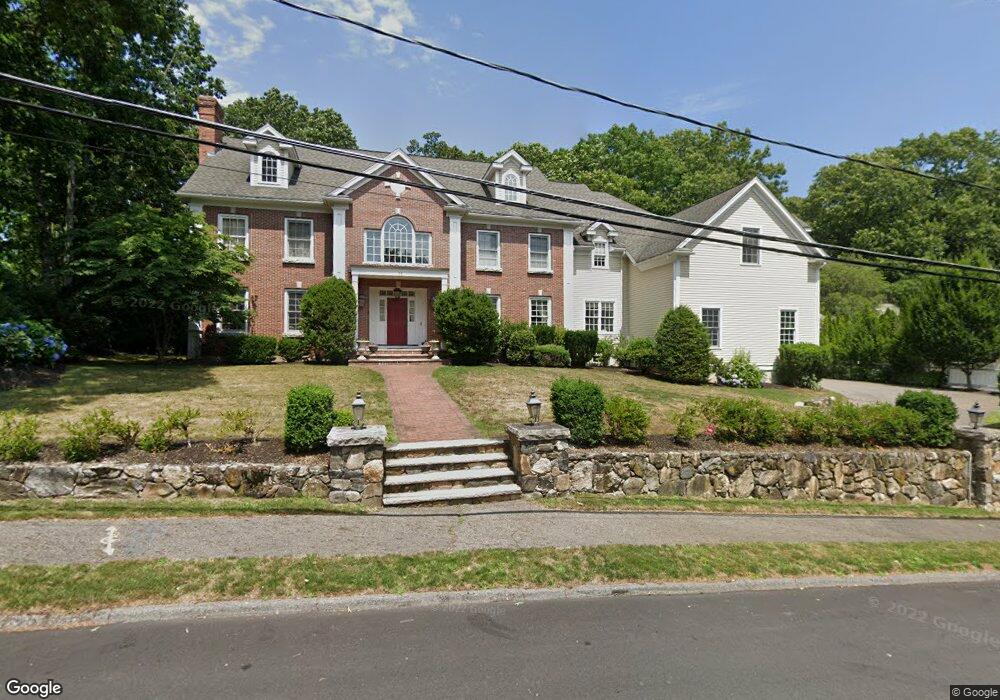
11 Cranmore Rd Wellesley, MA 02481
Estimated Value: $4,157,107 - $5,672,000
6
Beds
9
Baths
7,201
Sq Ft
$658/Sq Ft
Est. Value
About This Home
This home is located at 11 Cranmore Rd, Wellesley, MA 02481 and is currently estimated at $4,737,527, approximately $657 per square foot. 11 Cranmore Rd is a home located in Norfolk County with nearby schools including Ernest F. Upham Elementary School, Wellesley Middle School, and Wellesley Sr High School.
Ownership History
Date
Name
Owned For
Owner Type
Purchase Details
Closed on
Jul 8, 2015
Sold by
Thakore Nainoor C and Thakore Sangita
Bought by
Eneyni Mazen and Eneyni Janice E
Current Estimated Value
Home Financials for this Owner
Home Financials are based on the most recent Mortgage that was taken out on this home.
Original Mortgage
$1,903,135
Outstanding Balance
$1,491,176
Interest Rate
4%
Mortgage Type
Purchase Money Mortgage
Estimated Equity
$3,246,351
Purchase Details
Closed on
Dec 1, 2000
Sold by
Wellesley Rt
Bought by
Thakore Naindor C and Thakore Sangita
Home Financials for this Owner
Home Financials are based on the most recent Mortgage that was taken out on this home.
Original Mortgage
$1,495,000
Interest Rate
7.76%
Mortgage Type
Purchase Money Mortgage
Purchase Details
Closed on
Jun 15, 1999
Sold by
Willard Allen D and Willard Eleanor D
Bought by
Wellesley Rt
Create a Home Valuation Report for This Property
The Home Valuation Report is an in-depth analysis detailing your home's value as well as a comparison with similar homes in the area
Home Values in the Area
Average Home Value in this Area
Purchase History
| Date | Buyer | Sale Price | Title Company |
|---|---|---|---|
| Eneyni Mazen | $2,537,500 | -- | |
| Thakore Naindor C | $2,300,000 | -- | |
| Wellesley Rt | $575,000 | -- |
Source: Public Records
Mortgage History
| Date | Status | Borrower | Loan Amount |
|---|---|---|---|
| Open | Eneyni Mazen | $1,903,135 | |
| Previous Owner | Wellesley Rt | $500,000 | |
| Previous Owner | Wellesley Rt | $1,495,000 | |
| Previous Owner | Wellesley Rt | $1,495,000 |
Source: Public Records
Tax History Compared to Growth
Tax History
| Year | Tax Paid | Tax Assessment Tax Assessment Total Assessment is a certain percentage of the fair market value that is determined by local assessors to be the total taxable value of land and additions on the property. | Land | Improvement |
|---|---|---|---|---|
| 2025 | $31,107 | $3,026,000 | $1,239,000 | $1,787,000 |
| 2024 | $30,845 | $2,963,000 | $1,239,000 | $1,724,000 |
| 2023 | $30,239 | $2,641,000 | $1,082,000 | $1,559,000 |
| 2022 | $29,212 | $2,501,000 | $857,000 | $1,644,000 |
| 2021 | $29,387 | $2,501,000 | $857,000 | $1,644,000 |
| 2020 | $28,912 | $2,501,000 | $857,000 | $1,644,000 |
| 2019 | $28,937 | $2,501,000 | $857,000 | $1,644,000 |
| 2018 | $30,795 | $2,577,000 | $879,000 | $1,698,000 |
| 2017 | $30,383 | $2,577,000 | $879,000 | $1,698,000 |
| 2016 | $34,851 | $2,946,000 | $864,000 | $2,082,000 |
| 2015 | $33,998 | $2,941,000 | $864,000 | $2,077,000 |
Source: Public Records
Map
Nearby Homes