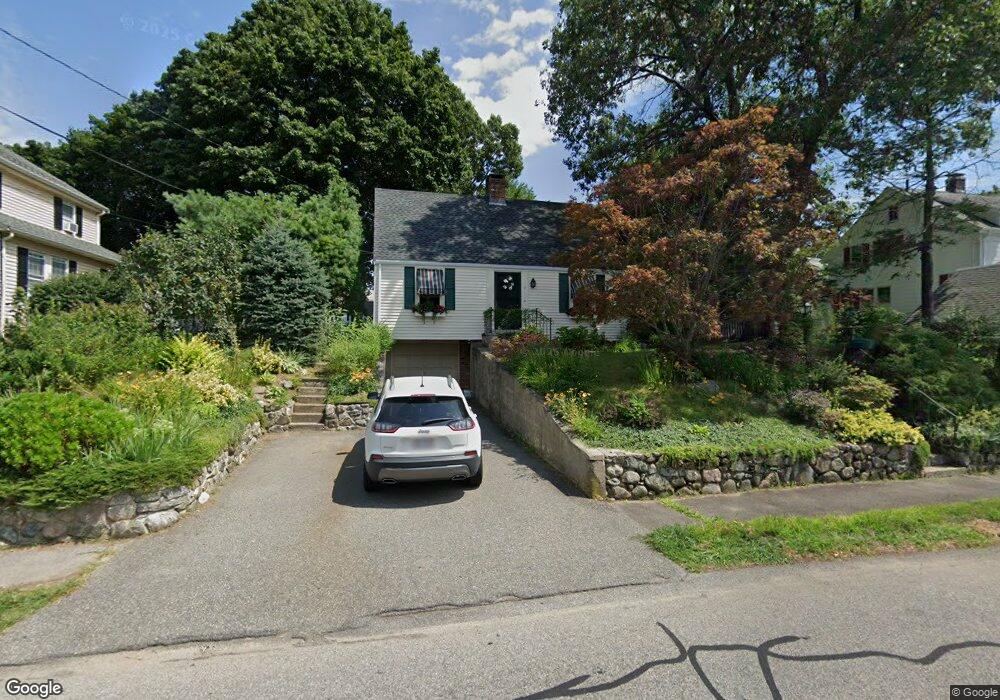
11 Crescent Rd Needham Heights, MA 02494
Estimated Value: $1,029,314 - $1,095,000
2
Beds
3
Baths
744
Sq Ft
$1,424/Sq Ft
Est. Value
About This Home
This home is located at 11 Crescent Rd, Needham Heights, MA 02494 and is currently estimated at $1,059,579, approximately $1,424 per square foot. 11 Crescent Rd is a home located in Norfolk County with nearby schools including Sunita L. Williams Elementary School, High Rock Middle School, and Pollard Middle School.
Ownership History
Date
Name
Owned For
Owner Type
Purchase Details
Closed on
Nov 29, 1988
Sold by
Collins William F
Bought by
Santamaria John P
Current Estimated Value
Home Financials for this Owner
Home Financials are based on the most recent Mortgage that was taken out on this home.
Original Mortgage
$127,000
Interest Rate
10.21%
Mortgage Type
Purchase Money Mortgage
Create a Home Valuation Report for This Property
The Home Valuation Report is an in-depth analysis detailing your home's value as well as a comparison with similar homes in the area
Home Values in the Area
Average Home Value in this Area
Purchase History
| Date | Buyer | Sale Price | Title Company |
|---|---|---|---|
| Santamaria John P | $194,000 | -- |
Source: Public Records
Mortgage History
| Date | Status | Borrower | Loan Amount |
|---|---|---|---|
| Open | Santamaria John P | $120,000 | |
| Closed | Santamaria John P | $126,000 | |
| Closed | Santamaria John P | $127,000 |
Source: Public Records
Tax History Compared to Growth
Tax History
| Year | Tax Paid | Tax Assessment Tax Assessment Total Assessment is a certain percentage of the fair market value that is determined by local assessors to be the total taxable value of land and additions on the property. | Land | Improvement |
|---|---|---|---|---|
| 2025 | $9,172 | $865,300 | $711,500 | $153,800 |
| 2024 | $7,926 | $633,100 | $471,200 | $161,900 |
| 2023 | $8,093 | $620,600 | $471,200 | $149,400 |
| 2022 | $7,587 | $567,500 | $424,400 | $143,100 |
| 2021 | $7,395 | $567,500 | $424,400 | $143,100 |
| 2020 | $7,111 | $569,300 | $426,300 | $143,000 |
| 2019 | $6,532 | $527,200 | $387,500 | $139,700 |
| 2018 | $6,263 | $527,200 | $387,500 | $139,700 |
| 2017 | $6,076 | $511,000 | $387,500 | $123,500 |
| 2016 | $5,897 | $511,000 | $387,500 | $123,500 |
| 2015 | $5,769 | $511,000 | $387,500 | $123,500 |
| 2014 | $5,477 | $470,500 | $352,300 | $118,200 |
Source: Public Records
Map
Nearby Homes
- 403 Hunnewell St Unit 403
- 379 Hunnewell St Unit 379
- 381 Hunnewell St Unit 381
- 400 Hunnewell St Unit 103
- 132 Hillside Ave
- 609 Hunnewell St
- 34 Pershing Rd
- 28 Mercer Rd
- 35 Andrea Cir
- 7 Avery St
- 263 Hunnewell St
- 77 High St
- 547 Webster St
- 27 Concord St
- 36 Davenport Rd
- 39 Donna Rd
- 14 Lasalle Rd
- 28 Woodbine Cir
- 638 Webster St Unit 638
- 638 Webster St
- 17 Crescent Rd
- 3 Crescent Rd
- 169 West St Unit 169
- 167 West St
- 321 Hillside Ave
- 323 Hillside Ave
- 311 Hillside Ave
- 4 Crescent Rd
- 309 Hillside Ave
- 21 Crescent Rd
- 21 Crescent Rd Unit 21
- 21 Crescent Rd Unit 1
- 12 Crescent Rd
- 23 Crescent Rd
- 23 Crescent Rd Unit 2
- 335 Hillside Ave
- 335 Hillside Ave Unit 335
- 335 Hillside Ave
- 335 Hillside Ave Unit 1
- 297 Hillside Ave