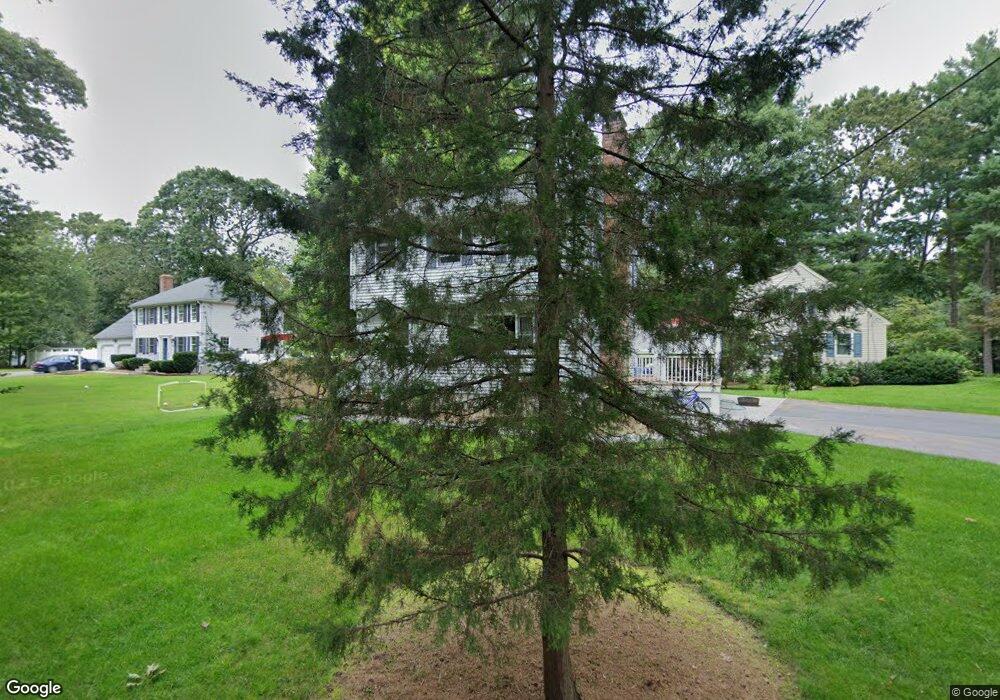
11 Crest Rd Natick, MA 01760
Estimated Value: $712,000 - $840,000
3
Beds
2
Baths
1,378
Sq Ft
$551/Sq Ft
Est. Value
About This Home
This home is located at 11 Crest Rd, Natick, MA 01760 and is currently estimated at $759,179, approximately $550 per square foot. 11 Crest Rd is a home located in Middlesex County with nearby schools including Natick High School, Bennett-Hemenway (Ben-Hem) Elementary School, and Wilson Middle School.
Ownership History
Date
Name
Owned For
Owner Type
Purchase Details
Closed on
Jul 28, 1989
Sold by
Madco Rt
Bought by
Sherman Dana E
Current Estimated Value
Purchase Details
Closed on
Dec 8, 1988
Sold by
Hoyt Reed W
Bought by
Madco Rt
Purchase Details
Closed on
Aug 9, 1988
Sold by
Nash Ted A
Bought by
Hoyt Reed W
Create a Home Valuation Report for This Property
The Home Valuation Report is an in-depth analysis detailing your home's value as well as a comparison with similar homes in the area
Home Values in the Area
Average Home Value in this Area
Purchase History
| Date | Buyer | Sale Price | Title Company |
|---|---|---|---|
| Sherman Dana E | $179,900 | -- | |
| Madco Rt | $57,000 | -- | |
| Hoyt Reed W | $22,000 | -- |
Source: Public Records
Mortgage History
| Date | Status | Borrower | Loan Amount |
|---|---|---|---|
| Open | Hoyt Reed W | $225,000 | |
| Closed | Hoyt Reed W | $139,000 | |
| Closed | Hoyt Reed W | $140,000 |
Source: Public Records
Tax History
| Year | Tax Paid | Tax Assessment Tax Assessment Total Assessment is a certain percentage of the fair market value that is determined by local assessors to be the total taxable value of land and additions on the property. | Land | Improvement |
|---|---|---|---|---|
| 2025 | $7,257 | $606,800 | $354,000 | $252,800 |
| 2024 | $7,036 | $573,900 | $333,200 | $240,700 |
| 2023 | $6,976 | $551,900 | $320,700 | $231,200 |
| 2022 | $6,861 | $514,300 | $291,600 | $222,700 |
| 2021 | $6,570 | $482,700 | $274,900 | $207,800 |
| 2020 | $3,694 | $474,800 | $262,400 | $212,400 |
| 2019 | $4,434 | $474,800 | $262,400 | $212,400 |
| 2018 | $6,057 | $464,100 | $249,900 | $214,200 |
| 2017 | $5,704 | $422,800 | $212,400 | $210,400 |
| 2016 | $4,790 | $353,000 | $188,700 | $164,300 |
| 2015 | $4,688 | $339,200 | $188,700 | $150,500 |
Source: Public Records
Map
Nearby Homes
- 278 N Main St
- 340 N Main St
- 293 Bacon St Unit A
- 50 Wethersfield Rd
- 5 Griffin Cir
- 136 Commonwealth Rd
- 7 Jackson Ct Unit B
- 4 Richard Rd
- 1 Richard Rd
- 40 Nouvelle Way Unit 441
- 13 Shawmut Avenue Extension
- 27 2nd St
- 29 Irving Rd
- 25 Irving Rd
- 8 Liberty St
- 45 W Plain St Unit 1
- 186 Main St
- 138 W Plain St
- 85 Lake Road Terrace
- 16 Arlington Rd
Your Personal Tour Guide
Ask me questions while you tour the home.