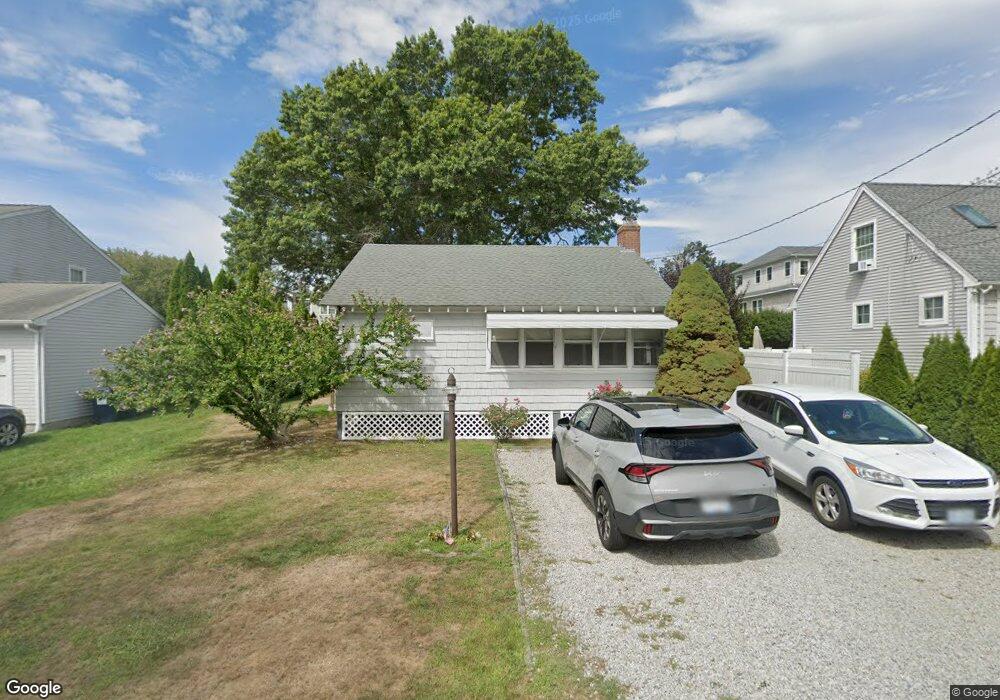
11 Cross Rd Narragansett, RI 02882
Estimated Value: $602,000 - $840,000
2
Beds
1
Bath
890
Sq Ft
$832/Sq Ft
Est. Value
About This Home
This home is located at 11 Cross Rd, Narragansett, RI 02882 and is currently estimated at $740,084, approximately $831 per square foot. 11 Cross Rd is a home located in Washington County with nearby schools including Narragansett Elementary School, Narragansett Pier Middle School, and Narragansett High School.
Ownership History
Date
Name
Owned For
Owner Type
Purchase Details
Closed on
Dec 20, 2017
Sold by
Barlow Peter G and Barlow Edith D
Bought by
Lester Steven D and Barlow Erin E
Current Estimated Value
Home Financials for this Owner
Home Financials are based on the most recent Mortgage that was taken out on this home.
Original Mortgage
$268,111
Outstanding Balance
$226,748
Interest Rate
3.75%
Mortgage Type
FHA
Estimated Equity
$513,336
Purchase Details
Closed on
Aug 11, 2017
Sold by
Barlow Edith D
Bought by
Barlow Peter G
Create a Home Valuation Report for This Property
The Home Valuation Report is an in-depth analysis detailing your home's value as well as a comparison with similar homes in the area
Home Values in the Area
Average Home Value in this Area
Purchase History
| Date | Buyer | Sale Price | Title Company |
|---|---|---|---|
| Lester Steven D | $310,000 | -- | |
| Barlow Peter G | -- | -- |
Source: Public Records
Mortgage History
| Date | Status | Borrower | Loan Amount |
|---|---|---|---|
| Open | Lester Steven D | $268,111 |
Source: Public Records
Tax History Compared to Growth
Tax History
| Year | Tax Paid | Tax Assessment Tax Assessment Total Assessment is a certain percentage of the fair market value that is determined by local assessors to be the total taxable value of land and additions on the property. | Land | Improvement |
|---|---|---|---|---|
| 2024 | $4,405 | $672,500 | $425,000 | $247,500 |
| 2023 | $4,136 | $444,200 | $250,000 | $194,200 |
| 2022 | $3,998 | $444,200 | $250,000 | $194,200 |
| 2021 | $3,936 | $444,200 | $250,000 | $194,200 |
| 2020 | $3,108 | $296,600 | $188,200 | $108,400 |
| 2019 | $3,034 | $296,600 | $188,200 | $108,400 |
| 2018 | $2,951 | $296,600 | $188,200 | $108,400 |
| 2017 | $2,845 | $269,400 | $192,500 | $76,900 |
| 2016 | $2,716 | $269,400 | $192,500 | $76,900 |
| 2015 | $2,678 | $269,400 | $192,500 | $76,900 |
| 2014 | $2,935 | $292,300 | $192,500 | $99,800 |
Source: Public Records
Map
Nearby Homes
- 18 Anawan Ave
- 55 Bonnet Shores Rd
- 53 Bonnet Shores Rd
- 51 Bonnet Shores Rd
- 74 Bayberry Rd
- 100 Algonquin Rd Unit 5
- 0 Betty Dr
- 55 S Ferry Rd
- 7 Leatherleaf Rd
- 80 Old Pine Rd
- 121 Spice Bush Trail
- 9 Courtland Dr
- 18 Lakeview Dr
- 7 Laneway Ct
- 727 Boston Neck Rd
- 23 Wilson Dr
- 10 Twin Leaf Trail
- 11 Tupelo Trail
- 41 Pettaquamscutt Lake Rd
- 991 Middlebridge Rd