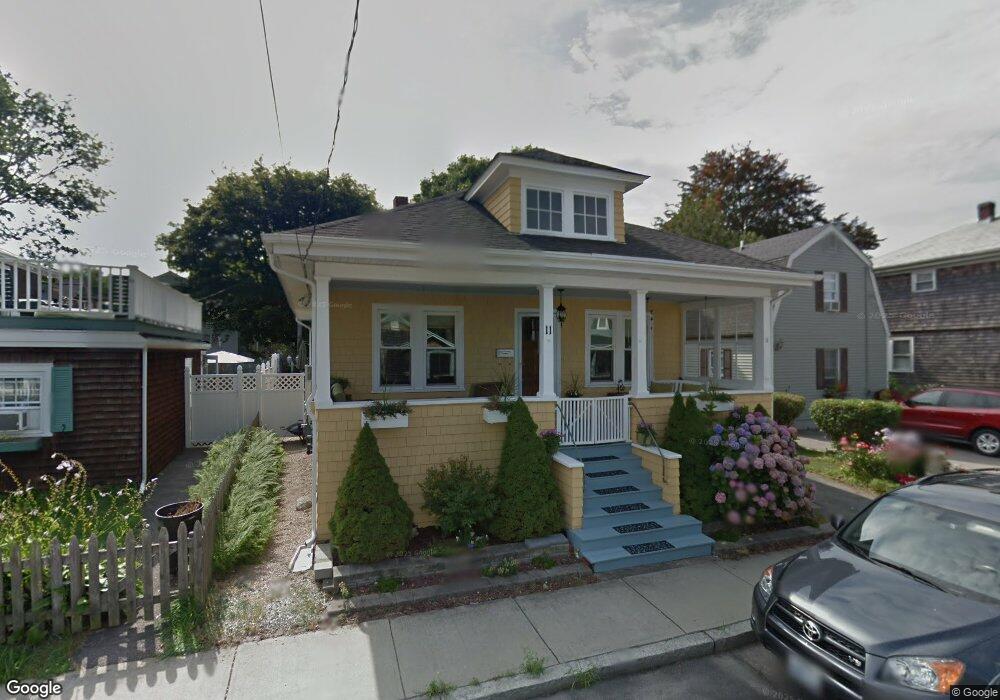
11 Curry Ave Newport, RI 02840
Estimated Value: $611,000 - $679,000
2
Beds
1
Bath
1,064
Sq Ft
$602/Sq Ft
Est. Value
About This Home
This home is located at 11 Curry Ave, Newport, RI 02840 and is currently estimated at $640,010, approximately $601 per square foot. 11 Curry Ave is a home located in Newport County with nearby schools including Rogers High School, St Michael's Country Day School, and All Saints STEAM Academy.
Ownership History
Date
Name
Owned For
Owner Type
Purchase Details
Closed on
Nov 23, 2011
Sold by
Urbanowicz Kelly Jean
Bought by
Whiting Alison F
Current Estimated Value
Home Financials for this Owner
Home Financials are based on the most recent Mortgage that was taken out on this home.
Original Mortgage
$213,750
Interest Rate
4.12%
Mortgage Type
Purchase Money Mortgage
Purchase Details
Closed on
Sep 2, 1998
Sold by
Mackenchnie Ian and Mackenchnie Martha P
Bought by
Urbanowicz Kelly Jean and Urbanowicz Edward
Home Financials for this Owner
Home Financials are based on the most recent Mortgage that was taken out on this home.
Original Mortgage
$106,288
Interest Rate
6.9%
Mortgage Type
Purchase Money Mortgage
Create a Home Valuation Report for This Property
The Home Valuation Report is an in-depth analysis detailing your home's value as well as a comparison with similar homes in the area
Home Values in the Area
Average Home Value in this Area
Purchase History
| Date | Buyer | Sale Price | Title Company |
|---|---|---|---|
| Whiting Alison F | $225,000 | -- | |
| Urbanowicz Kelly Jean | $106,500 | -- |
Source: Public Records
Mortgage History
| Date | Status | Borrower | Loan Amount |
|---|---|---|---|
| Open | Urbanowicz Kelly Jean | $216,000 | |
| Closed | Whiting Alison F | $213,750 | |
| Previous Owner | Urbanowicz Kelly Jean | $105,000 | |
| Previous Owner | Urbanowicz Kelly Jean | $106,288 |
Source: Public Records
Tax History Compared to Growth
Tax History
| Year | Tax Paid | Tax Assessment Tax Assessment Total Assessment is a certain percentage of the fair market value that is determined by local assessors to be the total taxable value of land and additions on the property. | Land | Improvement |
|---|---|---|---|---|
| 2025 | $3,653 | $508,800 | $201,800 | $307,000 |
| 2024 | $3,546 | $508,800 | $201,800 | $307,000 |
| 2023 | $3,430 | $345,800 | $142,600 | $203,200 |
| 2022 | $3,323 | $345,800 | $142,600 | $203,200 |
| 2021 | $3,226 | $345,800 | $142,600 | $203,200 |
| 2020 | $3,251 | $316,200 | $127,800 | $188,400 |
| 2019 | $3,251 | $316,200 | $127,800 | $188,400 |
| 2018 | $3,159 | $316,200 | $127,800 | $188,400 |
| 2017 | $3,105 | $277,000 | $74,600 | $202,400 |
| 2016 | $3,028 | $277,000 | $74,600 | $202,400 |
| 2015 | $3,105 | $291,000 | $74,600 | $216,400 |
| 2014 | $2,457 | $203,700 | $66,800 | $136,900 |
Source: Public Records
Map
Nearby Homes
- 5 Elliot Place
- 19 Princeton St Unit 21
- 1 Shangri-La Ln
- 117 W Main Rd
- 149 W Main Rd
- 1 Arnold Ave
- 155 Evarts St
- 138 Green End Ave
- 7 Sheffield Ave
- 125 Van Zandt Ave Unit 307
- 36 Kay Blvd
- 4 Newport Ave Unit B2
- 67 Linden St
- 17 Lincoln St
- 26 Prescott Hall Rd
- 66 Girard Ave Unit 401
- 198 Gibbs Ave
- 103 Champlin Place N
- 3 Vicksburg Place
- 53 Warner St