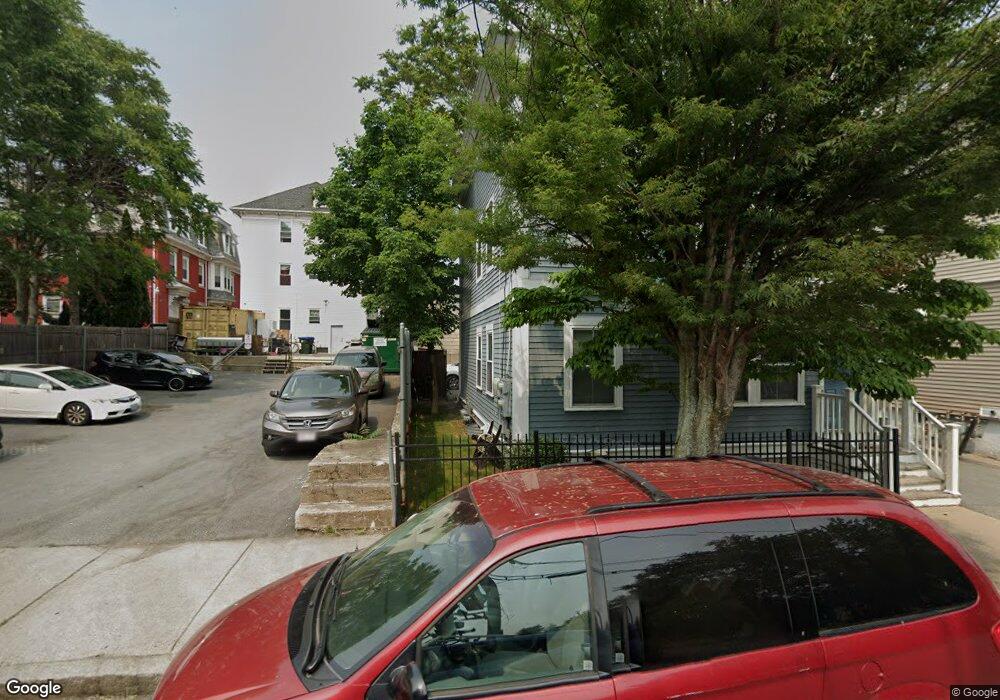
11 Curtis St Providence, RI 02909
Olneyville NeighborhoodEstimated Value: $405,000 - $526,399
5
Beds
2
Baths
1,600
Sq Ft
$291/Sq Ft
Est. Value
About This Home
This home is located at 11 Curtis St, Providence, RI 02909 and is currently estimated at $465,700, approximately $291 per square foot. 11 Curtis St is a home located in Providence County with nearby schools including Paul Cuffee Middle School, Blessed Sacrament School, and Mount Pleasant Academy.
Ownership History
Date
Name
Owned For
Owner Type
Purchase Details
Closed on
Apr 27, 2001
Sold by
Good Investment
Bought by
Holland James R
Current Estimated Value
Home Financials for this Owner
Home Financials are based on the most recent Mortgage that was taken out on this home.
Original Mortgage
$36,000
Outstanding Balance
$12,971
Interest Rate
6.88%
Mortgage Type
Purchase Money Mortgage
Estimated Equity
$452,729
Purchase Details
Closed on
Oct 6, 2000
Sold by
Cavallaro Michael P and Cavallaro Diane M
Bought by
Max Equi
Purchase Details
Closed on
Dec 11, 1995
Sold by
Maiorano Guy
Bought by
Cavallaro Michael P and Cavallaro Diane
Home Financials for this Owner
Home Financials are based on the most recent Mortgage that was taken out on this home.
Original Mortgage
$14,700
Interest Rate
7.44%
Mortgage Type
Purchase Money Mortgage
Create a Home Valuation Report for This Property
The Home Valuation Report is an in-depth analysis detailing your home's value as well as a comparison with similar homes in the area
Home Values in the Area
Average Home Value in this Area
Purchase History
| Date | Buyer | Sale Price | Title Company |
|---|---|---|---|
| Holland James R | $39,000 | -- | |
| Max Equi | $19,000 | -- | |
| Cavallaro Michael P | $21,000 | -- |
Source: Public Records
Mortgage History
| Date | Status | Borrower | Loan Amount |
|---|---|---|---|
| Open | Cavallaro Michael P | $36,000 | |
| Previous Owner | Cavallaro Michael P | $14,700 |
Source: Public Records
Map
Nearby Homes
Your Personal Tour Guide
Ask me questions while you tour the home.