
Seller's Agent in 2020
Pat Bagni-Latimer
MA Real Estate Center
(978) 815-6965
8 in this area
80 Total Sales
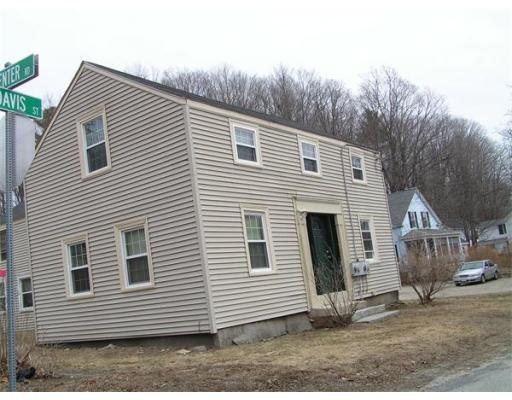
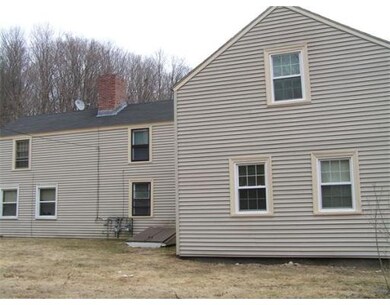
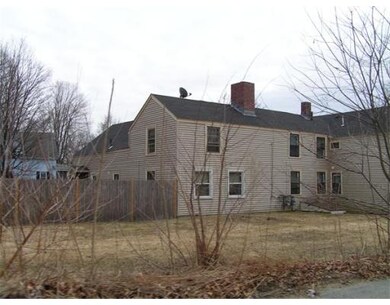
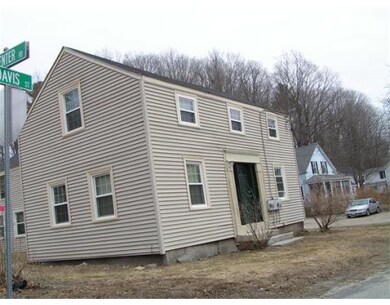
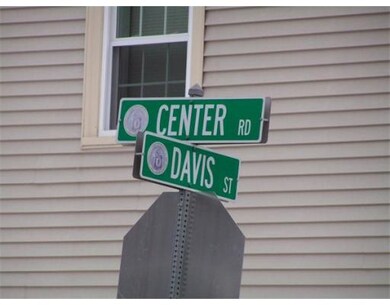

Since the purchase in 2010 the following have been updated, roof, windows, vinyl siding, electric, plumbing, baths and 2 of the kitchens. This property is a very short distance to the MBTA commuter rail station, Boston - Fitchburg Line, as well as to all that Shirley Village has to offer. Restaurants, variety stores, entertainment local to your front door. Great access for commuters to routes, 2, 2A, 110, 111, 495 north, south, east or west. Live in one unit and allow your tenants to pay your mortgage. The property is currently grossing $35,700 a year...interested ? schedule today ! .
Home Type
Multi-Family
Est. Annual Taxes
$60
Year Built
1776
Lot Details
0
| Date | Type | Sale Price | Title Company |
|---|---|---|---|
| Not Resolvable | $330,000 | None Available | |
| Not Resolvable | $285,000 | -- | |
| Deed | $145,000 | -- | |
| Foreclosure Deed | $165,750 | -- | |
| Deed | $240,000 | -- |
| Date | Status | Loan Amount | Loan Type |
|---|---|---|---|
| Open | $324,022 | FHA | |
| Previous Owner | $228,000 | New Conventional | |
| Previous Owner | $161,000 | Stand Alone Refi Refinance Of Original Loan | |
| Previous Owner | $160,000 | No Value Available | |
| Previous Owner | $116,000 | Purchase Money Mortgage | |
| Previous Owner | $236,000 | No Value Available | |
| Previous Owner | $192,000 | Purchase Money Mortgage |
| Date | Event | Price | Change | Sq Ft Price |
|---|---|---|---|---|
| 11/12/2020 11/12/20 | Sold | $330,000 | -4.3% | $108 / Sq Ft |
| 09/26/2020 09/26/20 | Pending | -- | -- | -- |
| 08/28/2020 08/28/20 | Price Changed | $345,000 | -2.8% | $113 / Sq Ft |
| 07/31/2020 07/31/20 | Price Changed | $355,000 | -2.7% | $116 / Sq Ft |
| 05/12/2020 05/12/20 | For Sale | $365,000 | +10.6% | $120 / Sq Ft |
| 03/27/2020 03/27/20 | Off Market | $330,000 | -- | -- |
| 01/06/2020 01/06/20 | Price Changed | $365,000 | -3.7% | $120 / Sq Ft |
| 11/20/2019 11/20/19 | For Sale | $379,000 | +33.0% | $124 / Sq Ft |
| 07/31/2014 07/31/14 | Sold | $285,000 | 0.0% | $91 / Sq Ft |
| 07/01/2014 07/01/14 | Pending | -- | -- | -- |
| 02/26/2014 02/26/14 | For Sale | $285,000 | -- | $91 / Sq Ft |
| Year | Tax Paid | Tax Assessment Tax Assessment Total Assessment is a certain percentage of the fair market value that is determined by local assessors to be the total taxable value of land and additions on the property. | Land | Improvement |
|---|---|---|---|---|
| 2025 | $60 | $460,000 | $131,200 | $328,800 |
| 2024 | $5,847 | $430,900 | $111,900 | $319,000 |
| 2023 | $5,356 | $377,700 | $111,900 | $265,800 |
| 2022 | $5,500 | $355,300 | $108,100 | $247,200 |
| 2021 | $5,923 | $358,300 | $96,500 | $261,800 |
| 2020 | $5,516 | $342,400 | $96,500 | $245,900 |
| 2019 | $5,401 | $335,900 | $96,500 | $239,400 |
| 2018 | $5,059 | $308,100 | $92,600 | $215,500 |
| 2017 | $4,639 | $280,800 | $84,900 | $195,900 |
| 2016 | $4,545 | $275,300 | $86,500 | $188,800 |
| 2015 | $4,161 | $240,400 | $81,100 | $159,300 |
Seller's Agent in 2020
Pat Bagni-Latimer
MA Real Estate Center
(978) 815-6965
8 in this area
80 Total Sales
Seller Co-Listing Agent in 2020
Ron Morrison
MA Real Estate Center
(978) 815-6965
5 in this area
59 Total Sales
Buyer's Agent in 2020
Fernando Perez
Cameron Real Estate Group
(857) 829-4208
1 in this area
30 Total Sales
Source: MLS Property Information Network (MLS PIN)
MLS Number: 71637520
APN: SHIR-000022-A000000-000024
Disclaimer: Certain information contained herein is derived from information provided by parties other than Homes.com. All information provided is deemed reliable, but is not guaranteed to be accurate and should be independently verified.
![]() The property listing data and information, or the Images, set forth herein were provided to MLS Property Information Network, Inc. from third party sources, including sellers, lessors and public records, and were compiled by MLS Property Information Network, Inc. The property listing data and information, and the Images, are for the personal, non-commercial use of consumers having a good faith interest in purchasing or leasing listed properties of the type displayed to them and may not be used for any purpose other than to identify prospective properties which such consumers may have a good faith interest in purchasing or leasing. MLS Property Information Network, Inc. and its subscribers disclaim any and all representations and warranties as to the accuracy of the property listing data and information, or as to the accuracy of any of the Images, set forth herein.
The property listing data and information, or the Images, set forth herein were provided to MLS Property Information Network, Inc. from third party sources, including sellers, lessors and public records, and were compiled by MLS Property Information Network, Inc. The property listing data and information, and the Images, are for the personal, non-commercial use of consumers having a good faith interest in purchasing or leasing listed properties of the type displayed to them and may not be used for any purpose other than to identify prospective properties which such consumers may have a good faith interest in purchasing or leasing. MLS Property Information Network, Inc. and its subscribers disclaim any and all representations and warranties as to the accuracy of the property listing data and information, or as to the accuracy of any of the Images, set forth herein.