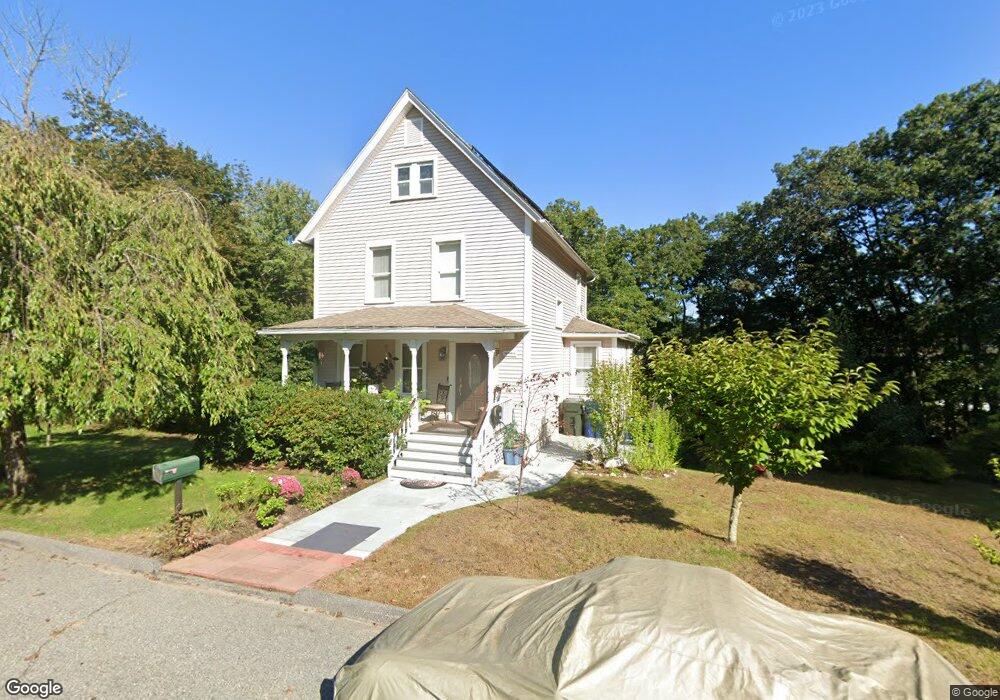
11 Davis St Willimantic, CT 06226
Estimated Value: $273,000 - $313,000
3
Beds
2
Baths
1,680
Sq Ft
$176/Sq Ft
Est. Value
About This Home
This home is located at 11 Davis St, Willimantic, CT 06226 and is currently estimated at $295,013, approximately $175 per square foot. 11 Davis St is a home located in Windham County with nearby schools including Windham Middle School, Windham High School, and St Mary St Joseph School.
Ownership History
Date
Name
Owned For
Owner Type
Purchase Details
Closed on
Aug 2, 2002
Sold by
Oyanadel David G
Bought by
Oyanadel Maria
Current Estimated Value
Purchase Details
Closed on
Apr 8, 1996
Sold by
Hollister Gregory Est and Hollister
Bought by
Oyanadel David
Purchase Details
Closed on
Dec 17, 1993
Sold by
Chemical Bk
Bought by
Hollister Gregory and Molochnick Steven
Purchase Details
Closed on
Sep 14, 1993
Sold by
Pehowdy Robert and Cotnoir Cm Ernest
Bought by
Chemical Bk
Create a Home Valuation Report for This Property
The Home Valuation Report is an in-depth analysis detailing your home's value as well as a comparison with similar homes in the area
Home Values in the Area
Average Home Value in this Area
Purchase History
| Date | Buyer | Sale Price | Title Company |
|---|---|---|---|
| Oyanadel Maria | $125,000 | -- | |
| Oyanadel David | $52,500 | -- | |
| Hollister Gregory | $35,000 | -- | |
| Chemical Bk | $32,750 | -- |
Source: Public Records
Mortgage History
| Date | Status | Borrower | Loan Amount |
|---|---|---|---|
| Open | Chemical Bk | $128,500 | |
| Closed | Chemical Bk | $61,000 |
Source: Public Records
Tax History
| Year | Tax Paid | Tax Assessment Tax Assessment Total Assessment is a certain percentage of the fair market value that is determined by local assessors to be the total taxable value of land and additions on the property. | Land | Improvement |
|---|---|---|---|---|
| 2025 | $5,282 | $142,690 | $31,070 | $111,620 |
| 2024 | $5,288 | $142,690 | $31,070 | $111,620 |
| 2023 | $4,244 | $89,530 | $27,020 | $62,510 |
| 2022 | $4,181 | $89,530 | $27,020 | $62,510 |
| 2021 | $4,485 | $89,530 | $27,020 | $62,510 |
| 2020 | $4,475 | $89,530 | $27,020 | $62,510 |
| 2019 | $4,402 | $89,530 | $27,020 | $62,510 |
| 2017 | $3,790 | $79,600 | $19,600 | $60,000 |
| 2015 | $3,582 | $77,900 | $19,600 | $58,300 |
| 2014 | $3,383 | $77,900 | $19,600 | $58,300 |
Source: Public Records
Map
Nearby Homes
Your Personal Tour Guide
Ask me questions while you tour the home.