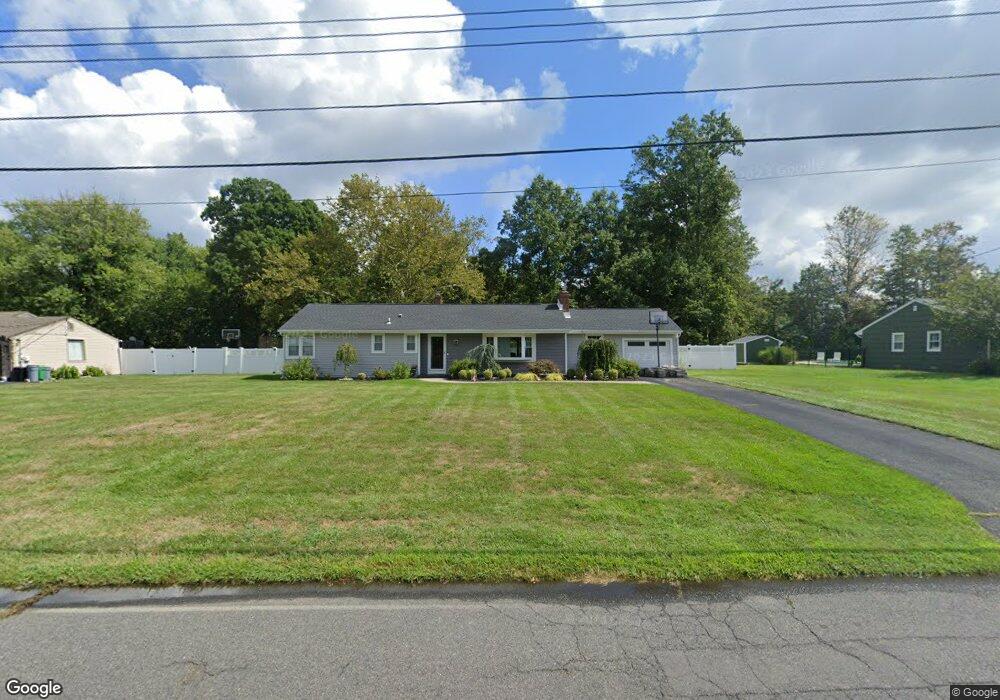
11 Davison Rd East Windsor, NJ 08520
Estimated Value: $479,000 - $541,000
Studio
--
Bath
1,590
Sq Ft
$317/Sq Ft
Est. Value
About This Home
This home is located at 11 Davison Rd, East Windsor, NJ 08520 and is currently estimated at $503,351, approximately $316 per square foot. 11 Davison Rd is a home located in Mercer County with nearby schools including Melvin H. Kreps Middle School, Hightstown High School, and SciCore Academy.
Ownership History
Date
Name
Owned For
Owner Type
Purchase Details
Closed on
Aug 4, 2005
Sold by
Blatchford George
Bought by
Hosmer Jennifer
Current Estimated Value
Home Financials for this Owner
Home Financials are based on the most recent Mortgage that was taken out on this home.
Original Mortgage
$224,510
Outstanding Balance
$119,073
Interest Rate
5.81%
Estimated Equity
$384,278
Create a Home Valuation Report for This Property
The Home Valuation Report is an in-depth analysis detailing your home's value as well as a comparison with similar homes in the area
Home Values in the Area
Average Home Value in this Area
Purchase History
| Date | Buyer | Sale Price | Title Company |
|---|---|---|---|
| Hosmer Jennifer | $283,000 | -- |
Source: Public Records
Mortgage History
| Date | Status | Borrower | Loan Amount |
|---|---|---|---|
| Open | Hosmer Jennifer | $224,510 |
Source: Public Records
Tax History
| Year | Tax Paid | Tax Assessment Tax Assessment Total Assessment is a certain percentage of the fair market value that is determined by local assessors to be the total taxable value of land and additions on the property. | Land | Improvement |
|---|---|---|---|---|
| 2025 | $10,531 | $283,100 | $178,800 | $104,300 |
| 2024 | $9,971 | $283,100 | $178,800 | $104,300 |
Source: Public Records
Map
Nearby Homes
- 12 Davison Rd
- 181 E Ward St
- 336 Monmouth St
- 344 Monmouth St
- 49 Woodside Ave
- 396 Monmouth St
- 104 1st Ave
- 125 Orchard Ave
- 305 Stockton St
- 215 Greeley St
- 309 Lincoln Ave
- 336 Stockton St
- 505 Summit St
- 357 Stockton St
- 333 Etra Rd
- 5 Rocky Brook Ct
- 4 Rocky Brook Ct
- 50 Frost Ln
- 23 Avon Dr W Unit A
- C9 Avon Dr E
Your Personal Tour Guide
Ask me questions while you tour the home.