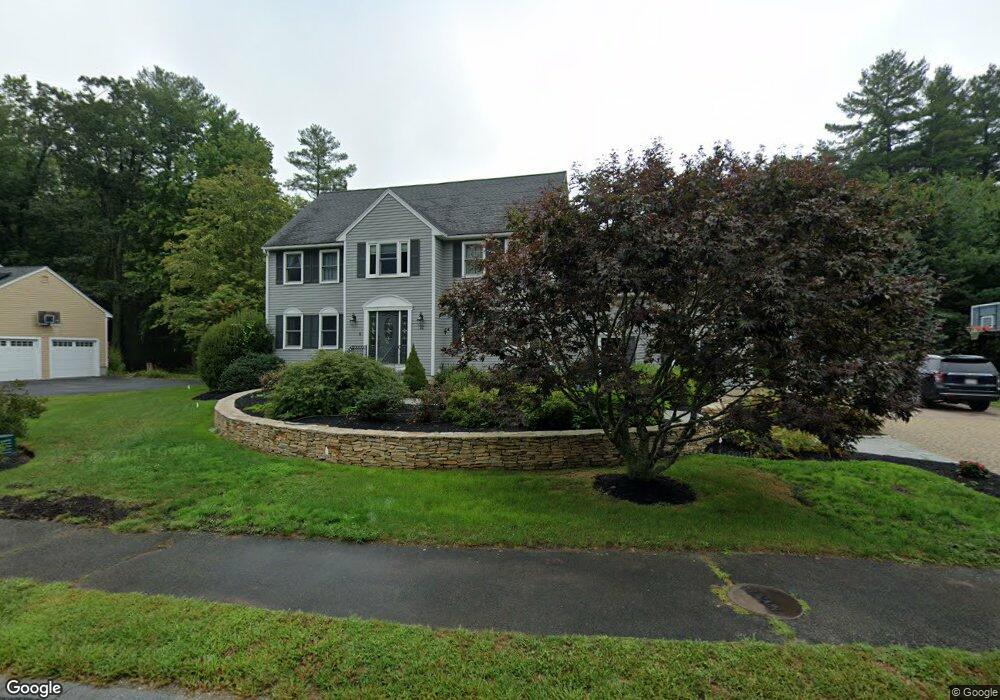
11 Dean St Medway, MA 02053
Estimated Value: $844,475 - $999,000
5
Beds
3
Baths
2,784
Sq Ft
$336/Sq Ft
Est. Value
About This Home
This home is located at 11 Dean St, Medway, MA 02053 and is currently estimated at $934,619, approximately $335 per square foot. 11 Dean St is a home located in Norfolk County with nearby schools including John D. McGovern Elementary School, Burke-Memorial Elementary, and Medway Middle School.
Ownership History
Date
Name
Owned For
Owner Type
Purchase Details
Closed on
Nov 19, 2025
Sold by
Kimberly Quinlivan and Kimberly Quinlivan
Bought by
Quinlivan Joseph and Quinlivan Kimberly A
Current Estimated Value
Purchase Details
Closed on
Nov 17, 2014
Sold by
Quinlivan Joseph and Quinlivan Kimberly A
Bought by
Kimberly A Quinlivan and Kimberly Quinlivan
Purchase Details
Closed on
Mar 18, 1996
Sold by
Pearson James O and Pearson Carol F
Bought by
Quinlivan Joseph P
Home Financials for this Owner
Home Financials are based on the most recent Mortgage that was taken out on this home.
Original Mortgage
$184,750
Interest Rate
7.25%
Mortgage Type
Purchase Money Mortgage
Purchase Details
Closed on
Jan 31, 1996
Sold by
Pearson James and Pearson Carol F
Bought by
Quinlivan Joseph
Home Financials for this Owner
Home Financials are based on the most recent Mortgage that was taken out on this home.
Original Mortgage
$184,750
Interest Rate
7.25%
Mortgage Type
Purchase Money Mortgage
Purchase Details
Closed on
Sep 21, 1993
Sold by
Osterman Stephen
Bought by
Pearson James and Pearson Carol F
Create a Home Valuation Report for This Property
The Home Valuation Report is an in-depth analysis detailing your home's value as well as a comparison with similar homes in the area
Home Values in the Area
Average Home Value in this Area
Purchase History
We collect this data history from publicly available records. To have your information removed, we recommend requesting removal directly through your county’s website.
| Date | Buyer | Sale Price | Title Company |
|---|---|---|---|
| Quinlivan Joseph | -- | -- | |
| Kimberly A Quinlivan | -- | -- | |
| Kimberly A Quinlivan T A | -- | -- | |
| Quinlivan Joseph P | $246,500 | -- | |
| Quinlivan Joseph | $246,500 | -- | |
| Quinlivan Joseph | $234,500 | -- | |
| Quinlivan Joseph P | $234,500 | -- | |
| Pearson James | $238,000 | -- |
Source: Public Records
Mortgage History
We collect this data history from publicly available records. To have your information removed, we recommend requesting removal directly through your county’s website.
| Date | Status | Borrower | Loan Amount |
|---|---|---|---|
| Previous Owner | Pearson James | $145,500 | |
| Previous Owner | Quinlivan Joseph P | $184,750 | |
| Previous Owner | Pearson James | $37,000 |
Source: Public Records
Tax History
| Year | Tax Paid | Tax Assessment Tax Assessment Total Assessment is a certain percentage of the fair market value that is determined by local assessors to be the total taxable value of land and additions on the property. | Land | Improvement |
|---|---|---|---|---|
| 2025 | $11,276 | $791,300 | $340,400 | $450,900 |
| 2024 | $11,395 | $791,300 | $340,400 | $450,900 |
| 2023 | $11,281 | $707,700 | $309,900 | $397,800 |
| 2022 | $10,424 | $615,700 | $229,300 | $386,400 |
| 2021 | $10,396 | $595,400 | $214,000 | $381,400 |
| 2020 | $10,281 | $587,500 | $214,000 | $373,500 |
| 2019 | $9,598 | $565,600 | $205,300 | $360,300 |
| 2018 | $8,920 | $505,100 | $196,600 | $308,500 |
| 2017 | $8,944 | $499,100 | $192,300 | $306,800 |
| 2016 | $8,762 | $483,800 | $177,000 | $306,800 |
| 2015 | $8,485 | $465,200 | $174,800 | $290,400 |
| 2014 | $8,484 | $450,300 | $175,400 | $274,900 |
Source: Public Records
Map
Nearby Homes
- 19 Holliston St
- 204 Village St
- 64 Holliston St
- 19 Barber St Unit B
- 20 Broad St Unit 1
- 20 Broad St Unit 5
- 37 North St
- 14 Sanford St Unit 66
- 14 Sanford St Unit 61
- 50 Main St
- 120 Village St Unit A
- 118 Village St Unit A
- 24 Vernon Rd
- 18 Anchorage Rd
- 6 Teresa Cir
- 3 Harmony Way Unit 3
- 25 Milford St
- 3 Pine Ridge Dr Unit 1
- 10 Cooper Dr
- 6 Hancock Rd
Your Personal Tour Guide
Ask me questions while you tour the home.