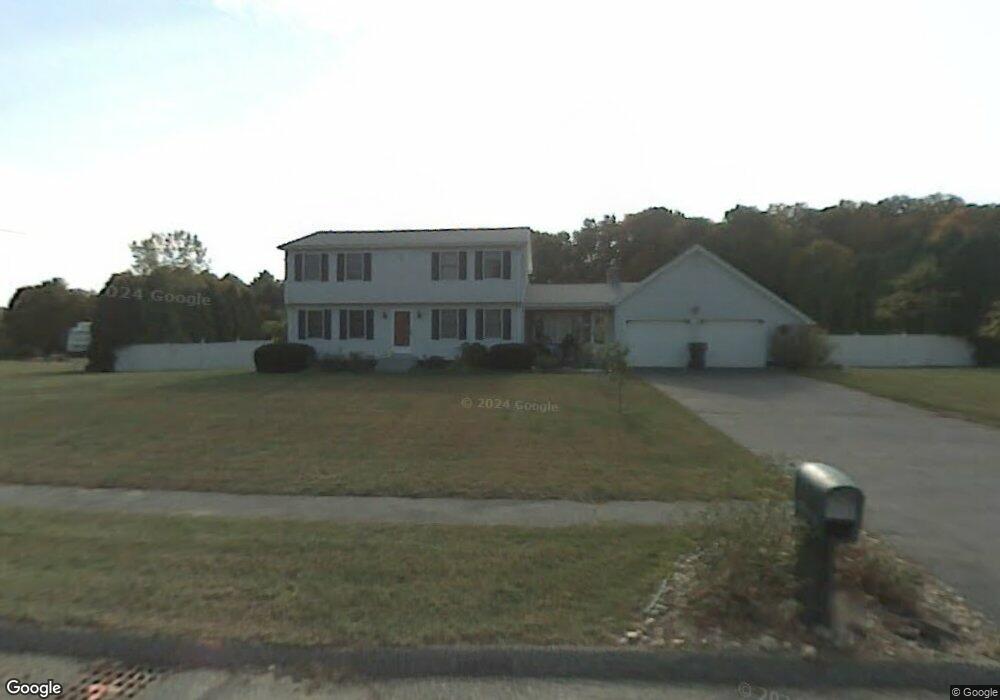
11 Deer Path Ln Westfield, MA 01085
Estimated Value: $487,221 - $755,000
3
Beds
2
Baths
2,054
Sq Ft
$282/Sq Ft
Est. Value
About This Home
This home is located at 11 Deer Path Ln, Westfield, MA 01085 and is currently estimated at $580,055, approximately $282 per square foot. 11 Deer Path Ln is a home located in Hampden County with nearby schools including Westfield High School, White Oak School, and Westfield Christian Academy.
Ownership History
Date
Name
Owned For
Owner Type
Purchase Details
Closed on
Jun 14, 2011
Sold by
Hoff Eric R and Hoff Dianne
Bought by
Strange Donald T
Current Estimated Value
Home Financials for this Owner
Home Financials are based on the most recent Mortgage that was taken out on this home.
Original Mortgage
$283,623
Outstanding Balance
$194,727
Interest Rate
4.62%
Mortgage Type
FHA
Estimated Equity
$385,328
Purchase Details
Closed on
Sep 16, 2005
Sold by
Relocation Prudential
Bought by
Hoff Dianne and Hoff Eric R
Purchase Details
Closed on
Jun 1, 2001
Sold by
Chmura Mary L and Chmura Mary Lou
Bought by
Mullen Jeffrey S and Mullen Tonya K
Create a Home Valuation Report for This Property
The Home Valuation Report is an in-depth analysis detailing your home's value as well as a comparison with similar homes in the area
Home Values in the Area
Average Home Value in this Area
Purchase History
| Date | Buyer | Sale Price | Title Company |
|---|---|---|---|
| Strange Donald T | $291,000 | -- | |
| Strange Donald T | $291,000 | -- | |
| Hoff Dianne | $318,000 | -- | |
| Relocation Prudential | $318,000 | -- | |
| Mullen Jeffrey S | $198,900 | -- | |
| Strange Donald T | $291,000 | -- | |
| Prudential Relocation | $318,000 | -- | |
| Mullen Jeffrey S | $198,900 | -- |
Source: Public Records
Mortgage History
| Date | Status | Borrower | Loan Amount |
|---|---|---|---|
| Open | Strange Donald T | $283,623 | |
| Closed | Mullen Jeffrey S | $283,623 |
Source: Public Records
Tax History
| Year | Tax Paid | Tax Assessment Tax Assessment Total Assessment is a certain percentage of the fair market value that is determined by local assessors to be the total taxable value of land and additions on the property. | Land | Improvement |
|---|---|---|---|---|
| 2025 | $6,360 | $419,000 | $151,500 | $267,500 |
| 2024 | $6,359 | $398,200 | $137,900 | $260,300 |
| 2023 | $6,213 | $379,800 | $131,400 | $248,400 |
| 2022 | $6,213 | $336,000 | $117,000 | $219,000 |
| 2021 | $6,028 | $319,300 | $110,500 | $208,800 |
| 2020 | $5,989 | $311,100 | $110,500 | $200,600 |
| 2019 | $5,858 | $297,800 | $105,300 | $192,500 |
| 2018 | $5,765 | $297,800 | $105,300 | $192,500 |
| 2017 | $5,653 | $291,100 | $106,600 | $184,500 |
| 2016 | $5,659 | $291,100 | $106,600 | $184,500 |
| 2015 | $5,276 | $284,600 | $106,600 | $178,000 |
| 2014 | $3,949 | $284,600 | $106,600 | $178,000 |
Source: Public Records
Map
Nearby Homes
- 336 Russellville Rd
- 7 1st Ave
- 16 1st Ave
- 132 North Rd
- 458 Montgomery Rd
- 868 Southampton Rd Unit 54
- 868 Southampton Rd Unit 70
- 5 Day Lily Ln
- 6 Madison Ave
- 24 Jaeger Dr
- 212 Montgomery Rd
- 45 Jaeger Dr
- 182 Lockhouse Rd
- Lot 5 Brickyard Rd
- 119 Brickyard Rd
- 202 Brickyard Rd
- 357 Southampton Rd
- 21 Old County Rd
- 0 Char Dr
- 745 West Rd
- 17 Deer Path Ln
- 283 Russellville Rd
- 14 Deer Path Ln
- 20 Deer Path Ln
- 25 Deer Path Ln
- 277 Russellville Rd
- 284 Russellville Rd
- 26 Deer Path Ln
- 297 Russellville Rd
- 222 & 246 Russellville Rd
- 31 Deer Path Ln
- 263 Russellville Rd
- 32 Deer Path Ln
- 301 Russellville Rd
- 270 Russellville Rd
- 37 Deer Path Ln
- 245 Russellville Rd
- 38 Deer Path Ln
- 288 Russellville Rd
- 308 Russellville Rd
Your Personal Tour Guide
Ask me questions while you tour the home.