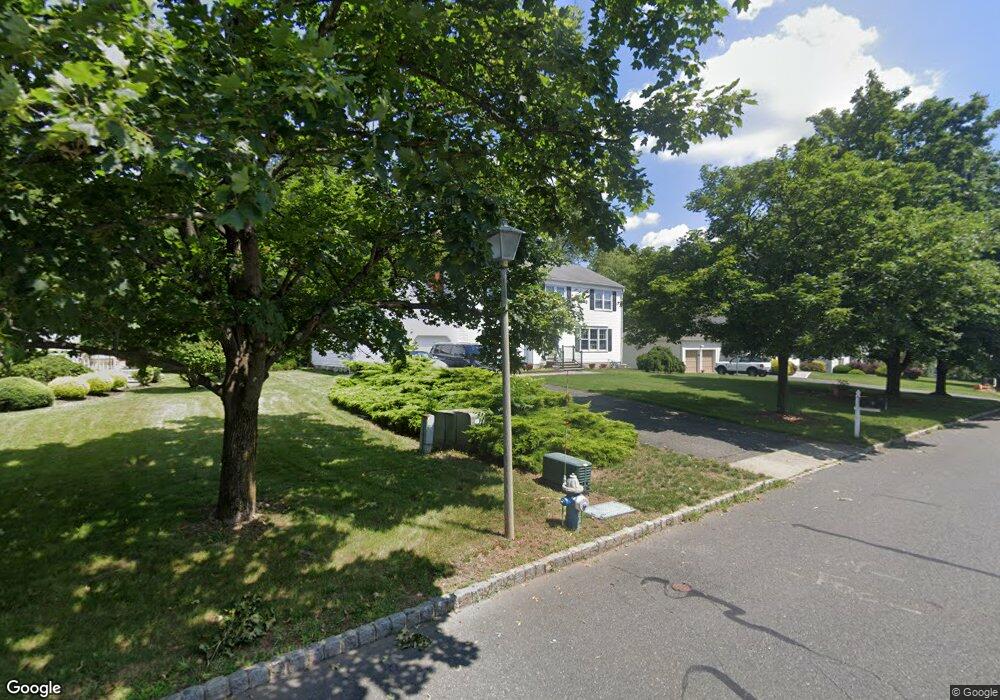
11 Deer Run Millington, NJ 07946
Estimated Value: $945,000 - $1,001,000
--
Bed
--
Bath
2,488
Sq Ft
$395/Sq Ft
Est. Value
About This Home
This home is located at 11 Deer Run, Millington, NJ 07946 and is currently estimated at $983,160, approximately $395 per square foot. 11 Deer Run is a home located in Morris County with nearby schools including Gillette Elementary School, Millington Elementary School, and Central Middle School.
Ownership History
Date
Name
Owned For
Owner Type
Purchase Details
Closed on
Feb 1, 2010
Sold by
Schweiger Nelly and Schweiger Frederick
Bought by
Laufer Ronald and Laufer Caroline
Current Estimated Value
Home Financials for this Owner
Home Financials are based on the most recent Mortgage that was taken out on this home.
Original Mortgage
$440,000
Outstanding Balance
$291,497
Interest Rate
5.05%
Mortgage Type
Stand Alone First
Estimated Equity
$691,663
Create a Home Valuation Report for This Property
The Home Valuation Report is an in-depth analysis detailing your home's value as well as a comparison with similar homes in the area
Home Values in the Area
Average Home Value in this Area
Purchase History
| Date | Buyer | Sale Price | Title Company |
|---|---|---|---|
| Laufer Ronald | $550,000 | First American Title Ins Co |
Source: Public Records
Mortgage History
| Date | Status | Borrower | Loan Amount |
|---|---|---|---|
| Open | Laufer Ronald | $440,000 |
Source: Public Records
Tax History Compared to Growth
Tax History
| Year | Tax Paid | Tax Assessment Tax Assessment Total Assessment is a certain percentage of the fair market value that is determined by local assessors to be the total taxable value of land and additions on the property. | Land | Improvement |
|---|---|---|---|---|
| 2025 | $15,784 | $727,000 | $272,800 | $454,200 |
| 2024 | $15,437 | $704,000 | $267,800 | $436,200 |
| 2023 | $15,437 | $687,600 | $262,800 | $424,800 |
| 2022 | $15,629 | $665,800 | $254,800 | $411,000 |
| 2021 | $15,629 | $634,300 | $236,300 | $398,000 |
| 2020 | $15,369 | $634,300 | $236,300 | $398,000 |
| 2019 | $15,172 | $634,300 | $234,800 | $399,500 |
| 2018 | $14,974 | $630,200 | $231,300 | $398,900 |
| 2017 | $14,732 | $625,300 | $227,800 | $397,500 |
| 2016 | $14,473 | $616,400 | $222,800 | $393,600 |
| 2015 | $12,567 | $428,600 | $189,600 | $239,000 |
| 2014 | $12,292 | $428,600 | $189,600 | $239,000 |
Source: Public Records
Map
Nearby Homes
- 34 Stonehedge Rd
- 10 Indian Run
- 379 Elm St
- 1 Joss Way
- 246 Main Ave
- 355 Elm St
- 0 Warren Ave
- 00 Warren Ave
- 1417 Long Hill Rd
- 234 High St
- 153 Mountain Ave
- 8 Metzler St
- 153 Mountain Avenue A
- 17 Sun Rd
- 92 Commonwealth Dr
- 40 Commonwealth Dr
- 58 Haas Rd
- 78 Commonwealth Dr
- 65 Jamestown Rd Unit 9
- 188 Jamestown Rd