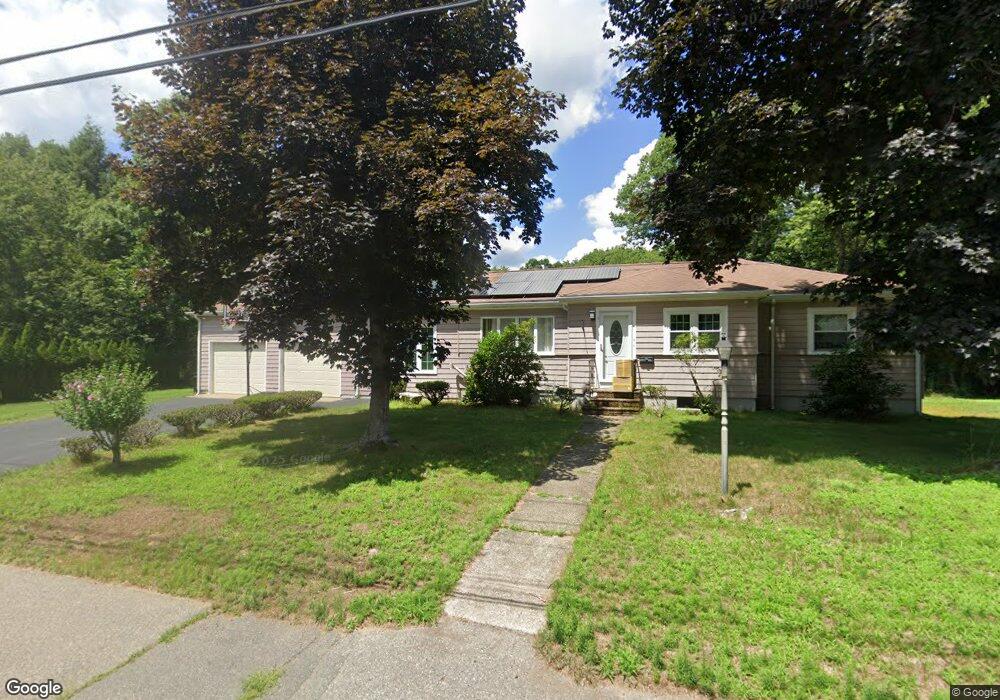
11 Deerfield Rd Sharon, MA 02067
Estimated Value: $714,000 - $789,061
3
Beds
2
Baths
1,850
Sq Ft
$401/Sq Ft
Est. Value
About This Home
This home is located at 11 Deerfield Rd, Sharon, MA 02067 and is currently estimated at $742,765, approximately $401 per square foot. 11 Deerfield Rd is a home located in Norfolk County with nearby schools including East Elementary School, Sharon Middle School, and Sharon High School.
Ownership History
Date
Name
Owned For
Owner Type
Purchase Details
Closed on
Jan 12, 2010
Sold by
Sandra Shmaryahu T
Bought by
Zhang Jia and Huang Wei
Current Estimated Value
Home Financials for this Owner
Home Financials are based on the most recent Mortgage that was taken out on this home.
Original Mortgage
$258,749
Outstanding Balance
$168,412
Interest Rate
4.78%
Mortgage Type
Purchase Money Mortgage
Estimated Equity
$574,353
Purchase Details
Closed on
Mar 31, 2008
Sold by
Shmaryahu Sandra
Bought by
Sandra Shmaryahu T
Purchase Details
Closed on
Jul 11, 1989
Sold by
Berman Leslie A
Bought by
Shmaryahu Yinon
Create a Home Valuation Report for This Property
The Home Valuation Report is an in-depth analysis detailing your home's value as well as a comparison with similar homes in the area
Home Values in the Area
Average Home Value in this Area
Purchase History
| Date | Buyer | Sale Price | Title Company |
|---|---|---|---|
| Zhang Jia | $344,000 | -- | |
| Sandra Shmaryahu T | -- | -- | |
| Shmaryahu Yinon | $205,500 | -- |
Source: Public Records
Mortgage History
| Date | Status | Borrower | Loan Amount |
|---|---|---|---|
| Open | Zhang Jia | $258,749 | |
| Previous Owner | Shmaryahu Yinon | $7,000 | |
| Previous Owner | Shmaryahu Yinon | $111,000 | |
| Previous Owner | Shmaryahu Yinon | $113,000 | |
| Previous Owner | Shmaryahu Yinon | $117,000 |
Source: Public Records
Tax History Compared to Growth
Tax History
| Year | Tax Paid | Tax Assessment Tax Assessment Total Assessment is a certain percentage of the fair market value that is determined by local assessors to be the total taxable value of land and additions on the property. | Land | Improvement |
|---|---|---|---|---|
| 2025 | $10,574 | $604,900 | $402,700 | $202,200 |
| 2024 | $10,144 | $577,000 | $369,500 | $207,500 |
| 2023 | $9,920 | $533,600 | $345,500 | $188,100 |
| 2022 | $9,539 | $483,000 | $287,800 | $195,200 |
| 2021 | $9,424 | $461,300 | $271,400 | $189,900 |
| 2020 | $8,765 | $461,300 | $271,400 | $189,900 |
| 2019 | $8,144 | $419,600 | $240,200 | $179,400 |
| 2018 | $8,037 | $414,900 | $235,500 | $179,400 |
| 2017 | $7,842 | $399,700 | $220,300 | $179,400 |
| 2016 | $7,720 | $383,900 | $220,300 | $163,600 |
| 2015 | $7,020 | $345,800 | $202,000 | $143,800 |
| 2014 | $6,492 | $315,900 | $183,600 | $132,300 |
Source: Public Records
Map
Nearby Homes