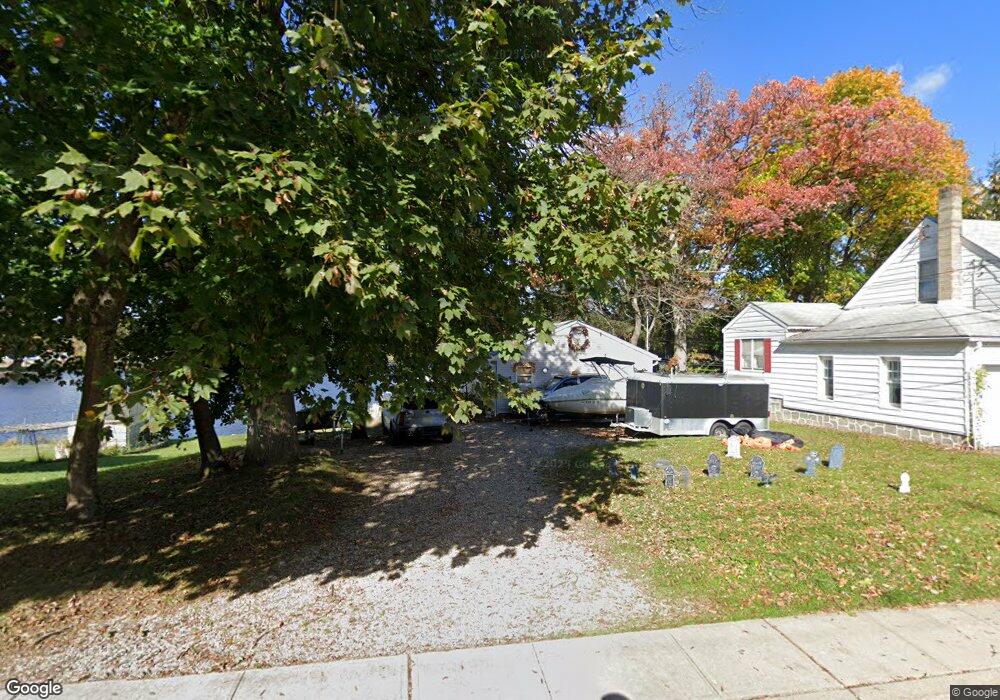
11 Dell Ave Netcong, NJ 07857
Estimated Value: $538,330 - $614,000
--
Bed
--
Bath
2,465
Sq Ft
$238/Sq Ft
Est. Value
About This Home
This home is located at 11 Dell Ave, Netcong, NJ 07857 and is currently estimated at $586,583, approximately $237 per square foot. 11 Dell Ave is a home located in Morris County with nearby schools including Netcong Elementary School and Lenape Val Regional High School.
Ownership History
Date
Name
Owned For
Owner Type
Purchase Details
Closed on
Mar 29, 2004
Sold by
Murphy John
Bought by
Hathaway Robert
Current Estimated Value
Home Financials for this Owner
Home Financials are based on the most recent Mortgage that was taken out on this home.
Original Mortgage
$264,000
Interest Rate
5.78%
Mortgage Type
New Conventional
Purchase Details
Closed on
Jul 27, 2000
Sold by
Murphy John F
Bought by
Murphy John F and Mariano John R
Purchase Details
Closed on
Dec 17, 1999
Sold by
Wood Arlene T
Bought by
Murphy John F
Home Financials for this Owner
Home Financials are based on the most recent Mortgage that was taken out on this home.
Original Mortgage
$130,488
Interest Rate
7.71%
Mortgage Type
FHA
Purchase Details
Closed on
Jun 8, 1999
Sold by
Wood Arthur L
Bought by
Wood Arlene L
Create a Home Valuation Report for This Property
The Home Valuation Report is an in-depth analysis detailing your home's value as well as a comparison with similar homes in the area
Home Values in the Area
Average Home Value in this Area
Purchase History
| Date | Buyer | Sale Price | Title Company |
|---|---|---|---|
| Hathaway Robert | $330,000 | -- | |
| Murphy John F | $65,737 | -- | |
| Murphy John F | $116,600 | -- | |
| Wood Arlene L | -- | -- |
Source: Public Records
Mortgage History
| Date | Status | Borrower | Loan Amount |
|---|---|---|---|
| Closed | Hathaway Robert | $66,000 | |
| Previous Owner | Hathaway Robert | $264,000 | |
| Previous Owner | Murphy John F | $130,488 |
Source: Public Records
Tax History Compared to Growth
Tax History
| Year | Tax Paid | Tax Assessment Tax Assessment Total Assessment is a certain percentage of the fair market value that is determined by local assessors to be the total taxable value of land and additions on the property. | Land | Improvement |
|---|---|---|---|---|
| 2025 | $10,675 | $312,400 | $129,300 | $183,100 |
| 2024 | $10,768 | $312,400 | $129,300 | $183,100 |
| 2023 | $10,768 | $312,400 | $129,300 | $183,100 |
| 2022 | $9,756 | $312,400 | $129,300 | $183,100 |
| 2021 | $9,756 | $312,400 | $129,300 | $183,100 |
| 2020 | $10,757 | $349,700 | $164,800 | $184,900 |
| 2019 | $10,239 | $349,700 | $164,800 | $184,900 |
| 2018 | $9,627 | $349,700 | $164,800 | $184,900 |
| 2017 | $9,250 | $349,700 | $164,800 | $184,900 |
| 2016 | $8,998 | $349,700 | $164,800 | $184,900 |
| 2015 | $8,669 | $349,700 | $164,800 | $184,900 |
| 2014 | $8,291 | $349,700 | $164,800 | $184,900 |
Source: Public Records
Map
Nearby Homes