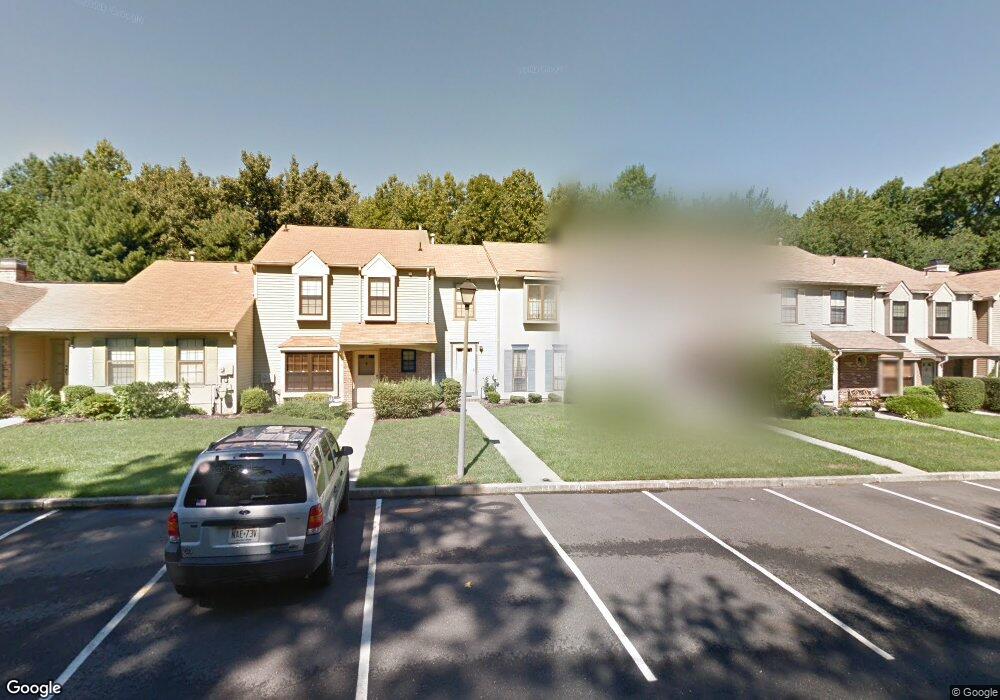
11 Devon Ct Trenton, NJ 08691
Estimated Value: $349,000 - $415,000
2
Beds
2
Baths
1,192
Sq Ft
$321/Sq Ft
Est. Value
About This Home
This home is located at 11 Devon Ct, Trenton, NJ 08691 and is currently estimated at $382,535, approximately $320 per square foot. 11 Devon Ct is a home located in Mercer County with nearby schools including Sharon Elementary School, Pond Road Middle School, and Robbinsville High School.
Ownership History
Date
Name
Owned For
Owner Type
Purchase Details
Closed on
Sep 11, 2019
Sold by
Yong Wei and Hu Yuchao
Bought by
Saadalla Daoud S
Current Estimated Value
Home Financials for this Owner
Home Financials are based on the most recent Mortgage that was taken out on this home.
Original Mortgage
$161,500
Outstanding Balance
$141,750
Interest Rate
3.7%
Mortgage Type
New Conventional
Estimated Equity
$240,785
Purchase Details
Closed on
Dec 22, 2011
Sold by
Sopo Jesse
Bought by
Yong Wei and Hu Yuchao
Home Financials for this Owner
Home Financials are based on the most recent Mortgage that was taken out on this home.
Original Mortgage
$191,031
Interest Rate
3.98%
Mortgage Type
FHA
Create a Home Valuation Report for This Property
The Home Valuation Report is an in-depth analysis detailing your home's value as well as a comparison with similar homes in the area
Home Values in the Area
Average Home Value in this Area
Purchase History
| Date | Buyer | Sale Price | Title Company |
|---|---|---|---|
| Saadalla Daoud S | $190,000 | Foundation Title Llc | |
| Yong Wei | $196,000 | None Available |
Source: Public Records
Mortgage History
| Date | Status | Borrower | Loan Amount |
|---|---|---|---|
| Open | Saadalla Daoud S | $161,500 | |
| Previous Owner | Yong Wei | $191,031 |
Source: Public Records
Tax History
| Year | Tax Paid | Tax Assessment Tax Assessment Total Assessment is a certain percentage of the fair market value that is determined by local assessors to be the total taxable value of land and additions on the property. | Land | Improvement |
|---|---|---|---|---|
| 2025 | $6,550 | $196,000 | $144,000 | $52,000 |
| 2024 | $6,113 | $196,000 | $144,000 | $52,000 |
Source: Public Records
Map
Nearby Homes
- 9 Devon Ct
- 64 Tynemouth Ct
- 144 Tynemouth Ct
- 139 Wyndham Place
- 109 Wyndham Place
- 69 Wickom Ave
- 35 Brown Dr
- 78 Wyndham Place Unit 129
- 78 Wyndham Place
- 8 Malsbury St
- 161 Andover Place
- 8 Chippin Ct
- 10 North St
- 14 Tasley Ct
- 6 Forman Dr
- 2 Tekening Way
- 44 Matthew Dr
- 117 George St
- 51 N Crest Ave
- 1 N Commerce Square Unit 305