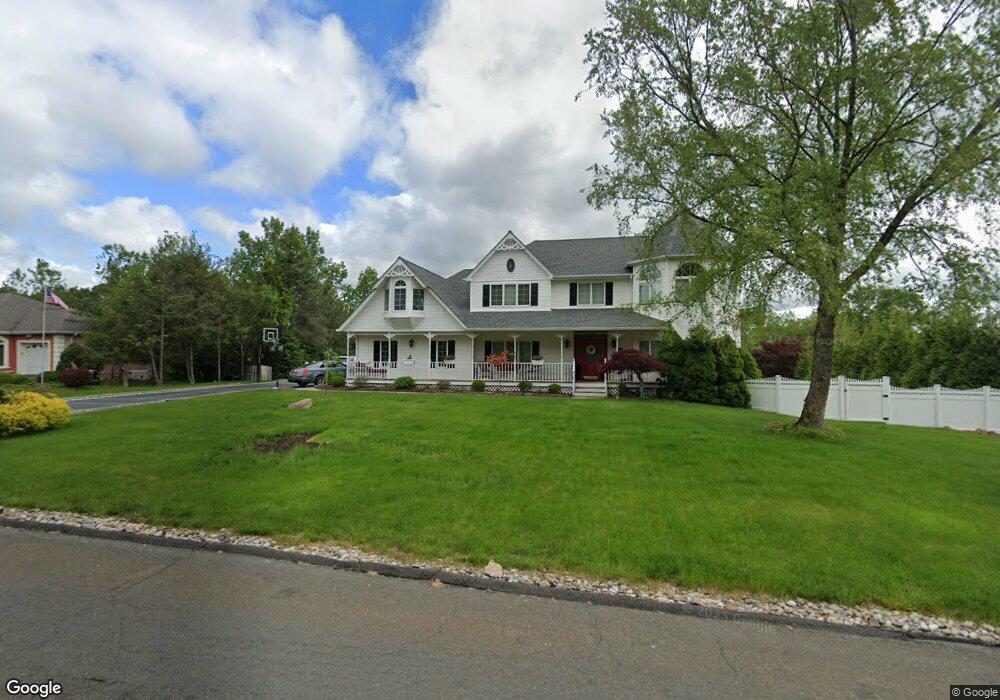
11 Dickens St Stony Point, NY 10980
Estimated Value: $975,146 - $1,690,000
4
Beds
3
Baths
3,402
Sq Ft
$373/Sq Ft
Est. Value
About This Home
This home is located at 11 Dickens St, Stony Point, NY 10980 and is currently estimated at $1,269,787, approximately $373 per square foot. 11 Dickens St is a home located in Rockland County with nearby schools including James A. Farley Middle School, Stony Point Elementary School, and Fieldstone Secondary School.
Ownership History
Date
Name
Owned For
Owner Type
Purchase Details
Closed on
Oct 6, 2004
Sold by
Marinucci Luigi
Bought by
Mcguinness John
Current Estimated Value
Home Financials for this Owner
Home Financials are based on the most recent Mortgage that was taken out on this home.
Original Mortgage
$712,000
Outstanding Balance
$343,375
Interest Rate
5.8%
Mortgage Type
Purchase Money Mortgage
Estimated Equity
$926,412
Purchase Details
Closed on
Jul 27, 2004
Sold by
Marinucci Joseph L
Bought by
Marinucci Luigi
Purchase Details
Closed on
Dec 13, 2002
Sold by
Crotty Raymond J and Crotty Laurie R
Bought by
Marinucci Joseph L
Home Financials for this Owner
Home Financials are based on the most recent Mortgage that was taken out on this home.
Original Mortgage
$515,000
Interest Rate
6.17%
Create a Home Valuation Report for This Property
The Home Valuation Report is an in-depth analysis detailing your home's value as well as a comparison with similar homes in the area
Home Values in the Area
Average Home Value in this Area
Purchase History
| Date | Buyer | Sale Price | Title Company |
|---|---|---|---|
| Mcguinness John | $890,000 | Christine Mcguinness | |
| Mcguinness John | $890,000 | Fidelity National Title Insu | |
| Marinucci Luigi | -- | Fidelity National Title Insu | |
| Marinucci Joseph L | $715,000 | The Judicial Title Ins Agenc |
Source: Public Records
Mortgage History
| Date | Status | Borrower | Loan Amount |
|---|---|---|---|
| Open | Mcguinness John | $712,000 | |
| Previous Owner | Marinucci Joseph L | $515,000 | |
| Closed | Mcguinness John | $30,000 |
Source: Public Records
Tax History
| Year | Tax Paid | Tax Assessment Tax Assessment Total Assessment is a certain percentage of the fair market value that is determined by local assessors to be the total taxable value of land and additions on the property. | Land | Improvement |
|---|---|---|---|---|
| 2024 | $24,078 | $70,000 | $11,000 | $59,000 |
| 2023 | $24,078 | $70,000 | $11,000 | $59,000 |
Source: Public Records
Map
Nearby Homes
- 15 Dickens St
- 6 Phillips Dr
- 6 Gooler Ct
- 7 Gooler Ct
- 26 Johnson Dr
- 54 Pyngyp Rd
- 178 Washburns Ln
- 3 N Mountain View
- 161 Washburns Ln
- 21 Benson Point Ct
- 285 Bulsontown Rd
- 309 Willow Grove Rd
- 121 Hammond Rd
- 4 Mccarthy Cir
- 35 Pierce Dr
- 8 Autumn Ln
- 1 Mccarthy Cir
- 17 John F. Kennedy Dr
- 33 de Halve Maen Dr
- 10 Sloane Ct
Your Personal Tour Guide
Ask me questions while you tour the home.