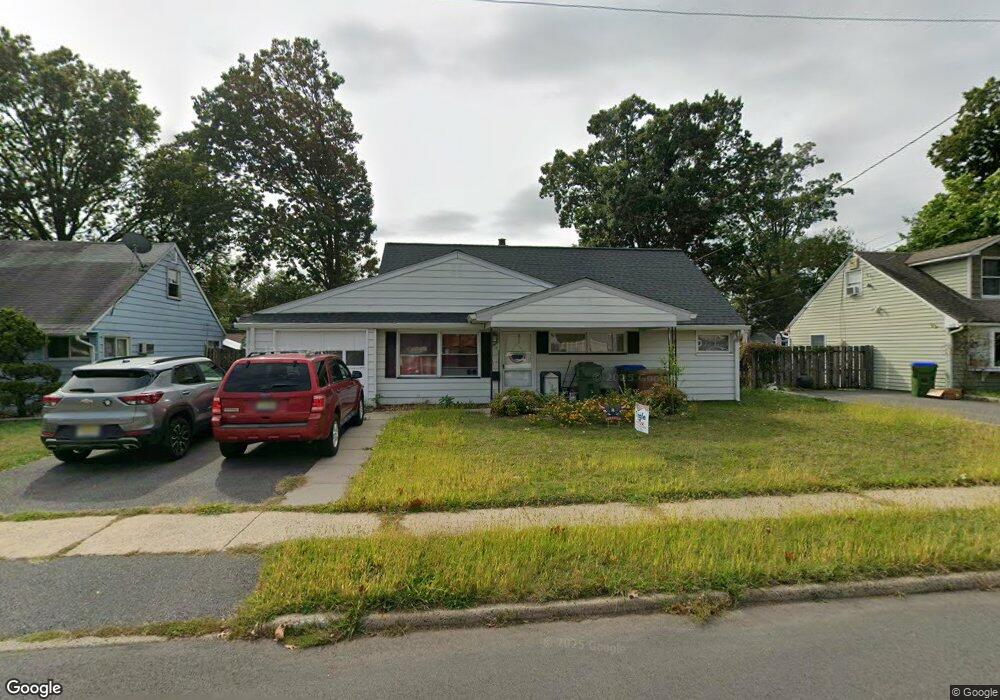
11 Dobson Rd Edison, NJ 08817
Estimated Value: $452,900 - $488,000
3
Beds
1
Bath
900
Sq Ft
$531/Sq Ft
Est. Value
About This Home
This home is located at 11 Dobson Rd, Edison, NJ 08817 and is currently estimated at $477,475, approximately $530 per square foot. 11 Dobson Rd is a home located in Middlesex County with nearby schools including Lincoln Elementary School, Herbert Hoover Middle School, and Edison High School.
Ownership History
Date
Name
Owned For
Owner Type
Purchase Details
Closed on
Dec 29, 2015
Sold by
Genova Thomas
Bought by
Campbell Sally A
Current Estimated Value
Home Financials for this Owner
Home Financials are based on the most recent Mortgage that was taken out on this home.
Original Mortgage
$164,000
Outstanding Balance
$130,475
Interest Rate
3.97%
Mortgage Type
New Conventional
Estimated Equity
$347,000
Create a Home Valuation Report for This Property
The Home Valuation Report is an in-depth analysis detailing your home's value as well as a comparison with similar homes in the area
Home Values in the Area
Average Home Value in this Area
Purchase History
| Date | Buyer | Sale Price | Title Company |
|---|---|---|---|
| Campbell Sally A | $20,500 | Weichert Title Agency |
Source: Public Records
Mortgage History
| Date | Status | Borrower | Loan Amount |
|---|---|---|---|
| Open | Campbell Sally A | $164,000 |
Source: Public Records
Tax History
| Year | Tax Paid | Tax Assessment Tax Assessment Total Assessment is a certain percentage of the fair market value that is determined by local assessors to be the total taxable value of land and additions on the property. | Land | Improvement |
|---|---|---|---|---|
| 2025 | $6,757 | $113,500 | $74,600 | $38,900 |
| 2024 | $6,720 | $113,500 | $74,600 | $38,900 |
| 2023 | $6,720 | $113,500 | $74,600 | $38,900 |
| 2022 | $6,723 | $113,500 | $74,600 | $38,900 |
| 2021 | $6,700 | $113,500 | $74,600 | $38,900 |
| 2020 | $6,639 | $113,500 | $74,600 | $38,900 |
| 2019 | $6,388 | $113,500 | $74,600 | $38,900 |
| 2018 | $6,233 | $113,500 | $74,600 | $38,900 |
| 2017 | $6,102 | $113,500 | $74,600 | $38,900 |
| 2016 | $5,914 | $112,100 | $74,600 | $37,500 |
| 2015 | $5,438 | $112,100 | $74,600 | $37,500 |
| 2014 | $5,272 | $112,100 | $74,600 | $37,500 |
Source: Public Records
Map
Nearby Homes
- 7 Dobson Rd
- 27 Stiles Rd
- 10 Magee Rd
- 13 Estok Rd
- 24 Magee Rd
- 484 Old Post Rd
- 5 Waverly Dr E
- 23 Colfax Rd
- 32 Waverly Dr W
- 13 Richmond Rd
- 14 Pine St
- 42 S Heathcote Ave
- 852 US Highway 1 Unit X3
- 852 U S Route 1 Unit J-2
- 852 U S Route 1 Unit 4
- 10 Elizabeth Ct
- 21 Heathcote Ave
- 21 Mcginnis Rd
- 120 Winthrop Rd
- 1590 Route 27
Your Personal Tour Guide
Ask me questions while you tour the home.