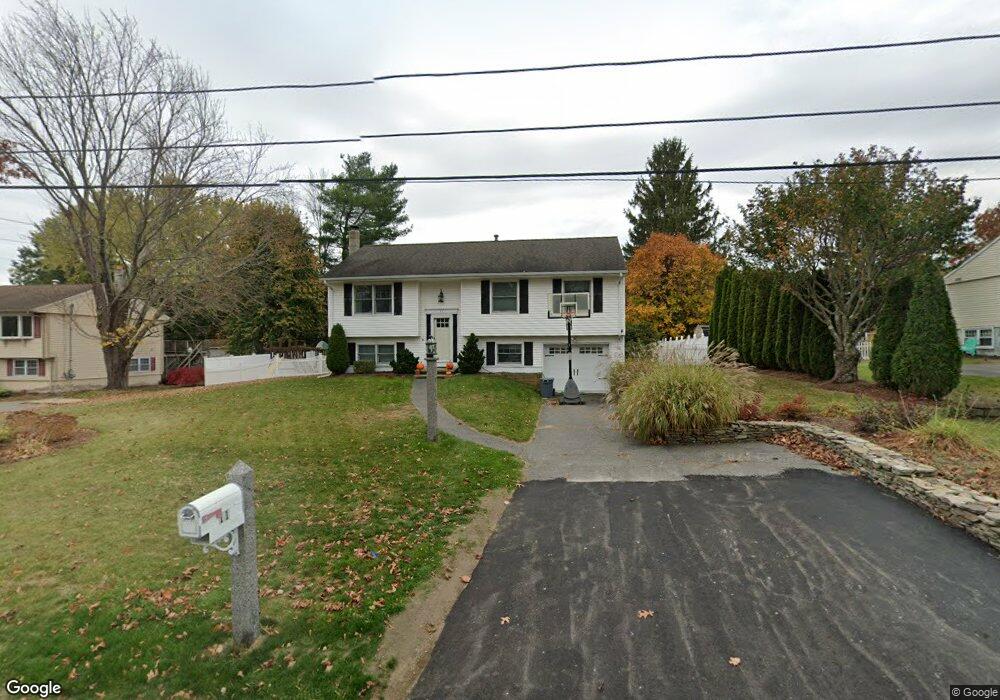
11 Drew St Newburyport, MA 01950
Estimated Value: $752,194 - $999,000
3
Beds
1
Bath
1,500
Sq Ft
$588/Sq Ft
Est. Value
About This Home
This home is located at 11 Drew St, Newburyport, MA 01950 and is currently estimated at $881,549, approximately $587 per square foot. 11 Drew St is a home located in Essex County with nearby schools including Francis T. Bresnahan Elementary School, Edward G. Molin Elementary School, and Rupert A. Nock Middle School.
Ownership History
Date
Name
Owned For
Owner Type
Purchase Details
Closed on
Jan 9, 2009
Sold by
Smith Charlene M and Smith Richard T
Bought by
Pervier Aaron J and Pervier Darcie L
Current Estimated Value
Home Financials for this Owner
Home Financials are based on the most recent Mortgage that was taken out on this home.
Original Mortgage
$312,800
Interest Rate
5.99%
Mortgage Type
Purchase Money Mortgage
Purchase Details
Closed on
Jul 10, 2002
Sold by
Douglas Geoffrey C and Douglas Ingrid
Bought by
Smith Richard T and Smith Charlene M
Purchase Details
Closed on
Jun 23, 1999
Sold by
Leavitt Stephen M and Leavitt Jacqueline
Bought by
Douglas Geoffrey C and Douglas Ingrid
Purchase Details
Closed on
Mar 27, 1992
Sold by
Wade Scott and Wade Michelle
Bought by
Leavitt Stephen M and Leavitt Jacqueline
Create a Home Valuation Report for This Property
The Home Valuation Report is an in-depth analysis detailing your home's value as well as a comparison with similar homes in the area
Home Values in the Area
Average Home Value in this Area
Purchase History
| Date | Buyer | Sale Price | Title Company |
|---|---|---|---|
| Pervier Aaron J | $369,000 | -- | |
| Smith Richard T | $312,000 | -- | |
| Douglas Geoffrey C | $222,000 | -- | |
| Leavitt Stephen M | $150,000 | -- |
Source: Public Records
Mortgage History
| Date | Status | Borrower | Loan Amount |
|---|---|---|---|
| Open | Leavitt Stephen M | $307,000 | |
| Closed | Leavitt Stephen M | $312,800 |
Source: Public Records
Tax History Compared to Growth
Tax History
| Year | Tax Paid | Tax Assessment Tax Assessment Total Assessment is a certain percentage of the fair market value that is determined by local assessors to be the total taxable value of land and additions on the property. | Land | Improvement |
|---|---|---|---|---|
| 2025 | $6,343 | $662,100 | $401,300 | $260,800 |
| 2024 | $6,237 | $625,600 | $364,800 | $260,800 |
| 2023 | $5,962 | $555,100 | $317,200 | $237,900 |
| 2022 | $5,547 | $461,900 | $264,300 | $197,600 |
| 2021 | $5,076 | $401,600 | $240,300 | $161,300 |
| 2020 | $5,157 | $401,600 | $240,300 | $161,300 |
| 2019 | $5,253 | $401,600 | $240,300 | $161,300 |
| 2018 | $5,097 | $384,400 | $228,900 | $155,500 |
| 2017 | $4,974 | $369,800 | $218,000 | $151,800 |
| 2016 | $4,812 | $359,400 | $207,600 | $151,800 |
| 2015 | $4,441 | $332,900 | $207,600 | $125,300 |
Source: Public Records
Map
Nearby Homes
- 7 Frances Dr
- 232 Low St Unit 7
- 8 Brown Ave
- 8 Hart Rd
- 61 Spofford St
- 17 Alberta Ave
- 42 Myrtle Ave
- 6 Storey Ave
- 28 Beacon St
- 8 Riverview Heights
- 572 Merrimac St
- 60 Merrimac St Unit 604
- 19 Cutter Ln Unit 19
- 510 Merrimac St Unit 512
- 138 Low St
- 492 Merrimac St
- 13 Bailey Pond Ln Unit 13
- 47 Cutter Ln Unit 47
- 110 Low St
- 35 Merrimac St