Estimated Value: $304,000 - $375,000
2
Beds
2
Baths
1,985
Sq Ft
$169/Sq Ft
Est. Value
About This Home
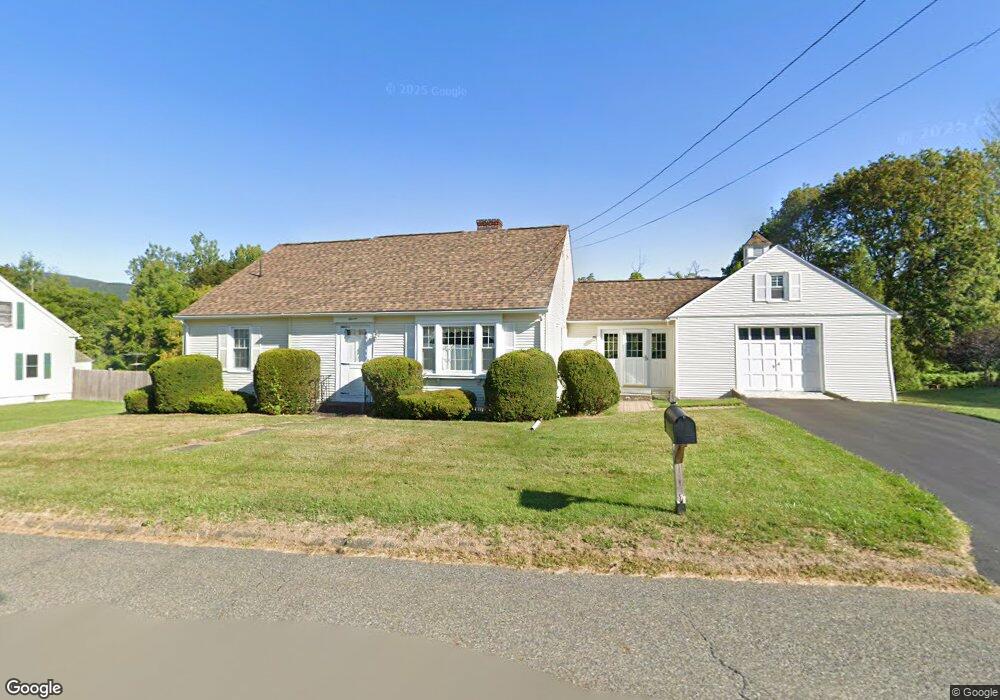
This home is located at 11 Dubis St, Adams, MA 01220 and is currently estimated at $334,843, approximately $168 per square foot. 11 Dubis St is a home located in Berkshire County with nearby schools including Hoosac Valley Middle & High School, Berkshire Arts & Technology Charter Public School, and St. Stanislaus Kostka School.
Ownership History
Date
Name
Owned For
Owner Type
Purchase Details
Closed on
May 30, 1990
Sold by
Bozek Ann G
Bought by
Lemoine David M
Current Estimated Value
Home Financials for this Owner
Home Financials are based on the most recent Mortgage that was taken out on this home.
Original Mortgage
$72,100
Interest Rate
10.25%
Mortgage Type
Purchase Money Mortgage
Create a Home Valuation Report for This Property
The Home Valuation Report is an in-depth analysis detailing your home's value as well as a comparison with similar homes in the area
Home Values in the Area
Average Home Value in this Area
Purchase History
| Date | Buyer | Sale Price | Title Company |
|---|---|---|---|
| Lemoine David M | $103,000 | -- |
Source: Public Records
Mortgage History
| Date | Status | Borrower | Loan Amount |
|---|---|---|---|
| Open | Lemoine David M | $65,000 | |
| Closed | Lemoine David M | $72,000 | |
| Closed | Lemoine David M | $72,100 |
Source: Public Records
Tax History
| Year | Tax Paid | Tax Assessment Tax Assessment Total Assessment is a certain percentage of the fair market value that is determined by local assessors to be the total taxable value of land and additions on the property. | Land | Improvement |
|---|---|---|---|---|
| 2025 | $4,508 | $265,000 | $54,600 | $210,400 |
| 2024 | $4,246 | $242,100 | $51,400 | $190,700 |
| 2023 | $3,933 | $212,000 | $46,700 | $165,300 |
| 2022 | $3,825 | $183,100 | $40,600 | $142,500 |
| 2021 | $3,728 | $164,800 | $40,600 | $124,200 |
| 2020 | $3,560 | $162,700 | $41,100 | $121,600 |
| 2019 | $3,480 | $162,700 | $41,100 | $121,600 |
| 2018 | $4,007 | $180,400 | $41,100 | $139,300 |
| 2017 | $3,716 | $173,900 | $41,100 | $132,800 |
| 2016 | $3,375 | $157,800 | $41,100 | $116,700 |
| 2015 | $3,289 | $153,900 | $42,900 | $111,000 |
| 2014 | $3,070 | $153,900 | $42,900 | $111,000 |
Source: Public Records
Map
Nearby Homes
Your Personal Tour Guide
Ask me questions while you tour the home.