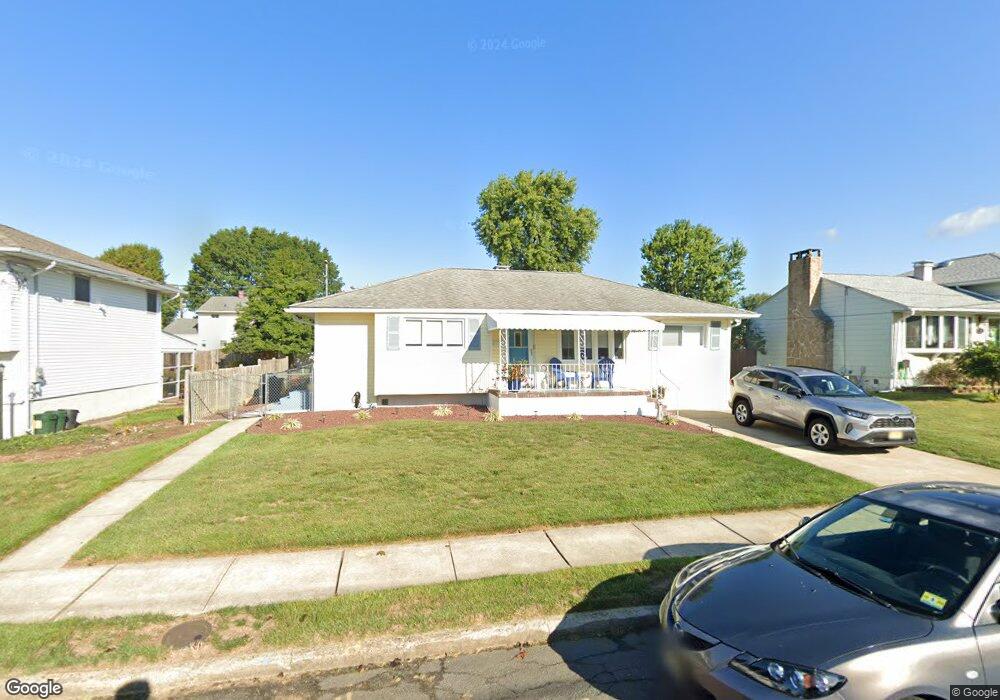
11 Duncan Dr Trenton, NJ 08690
Estimated Value: $370,716 - $509,000
--
Bed
--
Bath
1,246
Sq Ft
$361/Sq Ft
Est. Value
About This Home
This home is located at 11 Duncan Dr, Trenton, NJ 08690 and is currently estimated at $450,179, approximately $361 per square foot. 11 Duncan Dr is a home located in Mercer County with nearby schools including Langtree Elementary School, Richard C. Crockett Middle School, and Steinert - Hamilton High East.
Ownership History
Date
Name
Owned For
Owner Type
Purchase Details
Closed on
Jun 15, 2009
Sold by
Siracusa Vincent and Siracusa Lisa A
Bought by
Siracusa Vincent
Current Estimated Value
Home Financials for this Owner
Home Financials are based on the most recent Mortgage that was taken out on this home.
Original Mortgage
$180,000
Outstanding Balance
$114,583
Interest Rate
4.91%
Mortgage Type
Stand Alone Refi Refinance Of Original Loan
Estimated Equity
$335,596
Create a Home Valuation Report for This Property
The Home Valuation Report is an in-depth analysis detailing your home's value as well as a comparison with similar homes in the area
Home Values in the Area
Average Home Value in this Area
Purchase History
| Date | Buyer | Sale Price | Title Company |
|---|---|---|---|
| Siracusa Vincent | -- | General Abstract & Title Age | |
| Siracusa Vincent | -- | -- |
Source: Public Records
Mortgage History
| Date | Status | Borrower | Loan Amount |
|---|---|---|---|
| Open | Siracusa Vincent | $180,000 |
Source: Public Records
Tax History Compared to Growth
Tax History
| Year | Tax Paid | Tax Assessment Tax Assessment Total Assessment is a certain percentage of the fair market value that is determined by local assessors to be the total taxable value of land and additions on the property. | Land | Improvement |
|---|---|---|---|---|
| 2025 | $7,890 | $223,900 | $81,900 | $142,000 |
| 2024 | $7,395 | $223,900 | $81,900 | $142,000 |
| 2023 | $7,395 | $223,900 | $81,900 | $142,000 |
| 2022 | $7,279 | $223,900 | $81,900 | $142,000 |
| 2021 | $7,664 | $223,900 | $81,900 | $142,000 |
| 2020 | $6,858 | $223,900 | $81,900 | $142,000 |
| 2019 | $6,706 | $223,900 | $81,900 | $142,000 |
| 2018 | $6,668 | $223,900 | $81,900 | $142,000 |
| 2017 | $6,498 | $223,900 | $81,900 | $142,000 |
| 2016 | $6,054 | $223,900 | $81,900 | $142,000 |
| 2015 | $6,365 | $138,700 | $48,500 | $90,200 |
| 2014 | $6,257 | $138,700 | $48,500 | $90,200 |
Source: Public Records
Map
Nearby Homes
- 97 Hummingbird Dr
- 897 Estates Blvd
- 70 Nightingale Dr
- 17 Marjorie Way
- 16 Marjorie Way
- 18 Goldfinch Dr
- 151 Meadowlark Dr
- 229 Meadowlark Dr
- 2370 White Horse-Hamilton Square
- 269 Meadowlark Dr
- 66 Willow Ct
- 1968 Klockner Rd
- 704 Silver Ct
- 65 Mulberry Ct
- 17 Mulberry Ct
- 28 Holly Ct Unit F3
- 8 Dove Ct
- 30 Holly Ct
- 25 Mulberry Ct
- 135 Herbert Ave