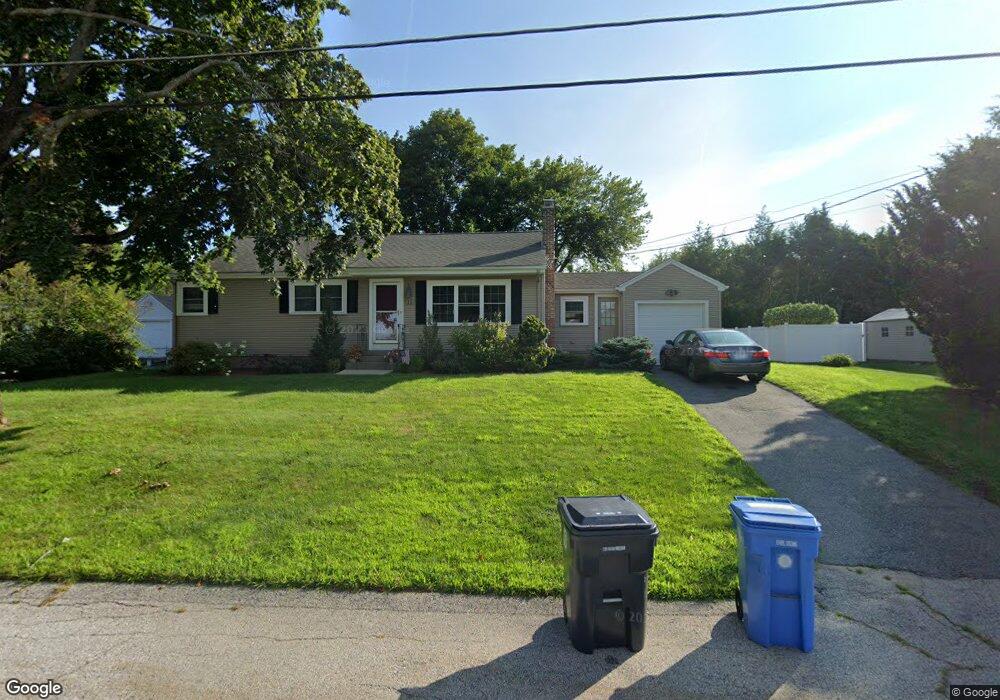
11 Dwight St Cumberland, RI 02864
Cumberland Hill NeighborhoodEstimated Value: $459,000 - $508,000
3
Beds
1
Bath
1,092
Sq Ft
$439/Sq Ft
Est. Value
About This Home
This home is located at 11 Dwight St, Cumberland, RI 02864 and is currently estimated at $479,258, approximately $438 per square foot. 11 Dwight St is a home located in Providence County with nearby schools including Ashton Elementary School, North Cumberland Middle School, and Cumberland High School.
Ownership History
Date
Name
Owned For
Owner Type
Purchase Details
Closed on
Mar 20, 2021
Sold by
Hecht James M and Hecht Melissa
Bought by
Hecht James M
Current Estimated Value
Home Financials for this Owner
Home Financials are based on the most recent Mortgage that was taken out on this home.
Original Mortgage
$198,000
Outstanding Balance
$176,192
Interest Rate
2.8%
Mortgage Type
New Conventional
Estimated Equity
$303,066
Purchase Details
Closed on
Mar 23, 2010
Sold by
Premier Properties Inc
Bought by
Hecht James M and Hecht Melissa
Purchase Details
Closed on
Oct 27, 2009
Sold by
American Home Mtg Svcs
Bought by
Premier Properties
Purchase Details
Closed on
May 1, 2008
Sold by
Mitchell Alan and Mitchell Kim
Bought by
American Home Mortgage
Create a Home Valuation Report for This Property
The Home Valuation Report is an in-depth analysis detailing your home's value as well as a comparison with similar homes in the area
Home Values in the Area
Average Home Value in this Area
Purchase History
| Date | Buyer | Sale Price | Title Company |
|---|---|---|---|
| Hecht James M | -- | None Available | |
| Hecht James M | $235,000 | -- | |
| Premier Properties | $130,000 | -- | |
| American Home Mortgage | $203,500 | -- |
Source: Public Records
Mortgage History
| Date | Status | Borrower | Loan Amount |
|---|---|---|---|
| Open | Hecht James M | $198,000 | |
| Previous Owner | American Home Mortgage | $30,000 |
Source: Public Records
Tax History
| Year | Tax Paid | Tax Assessment Tax Assessment Total Assessment is a certain percentage of the fair market value that is determined by local assessors to be the total taxable value of land and additions on the property. | Land | Improvement |
|---|---|---|---|---|
| 2025 | $4,324 | $352,400 | $159,900 | $192,500 |
| 2024 | $4,211 | $352,400 | $159,900 | $192,500 |
| 2023 | $4,095 | $352,400 | $159,900 | $192,500 |
| 2022 | $3,864 | $257,800 | $99,900 | $157,900 |
| 2021 | $3,800 | $257,800 | $99,900 | $157,900 |
| 2020 | $3,692 | $257,800 | $99,900 | $157,900 |
| 2019 | $3,729 | $234,800 | $98,200 | $136,600 |
| 2018 | $3,621 | $234,800 | $98,200 | $136,600 |
| 2017 | $3,571 | $234,800 | $98,200 | $136,600 |
| 2016 | $3,124 | $182,900 | $94,500 | $88,400 |
| 2015 | $3,124 | $182,900 | $94,500 | $88,400 |
| 2014 | $3,112 | $182,200 | $94,500 | $87,700 |
| 2013 | $3,314 | $210,000 | $96,300 | $113,700 |
Source: Public Records
Map
Nearby Homes
Your Personal Tour Guide
Ask me questions while you tour the home.