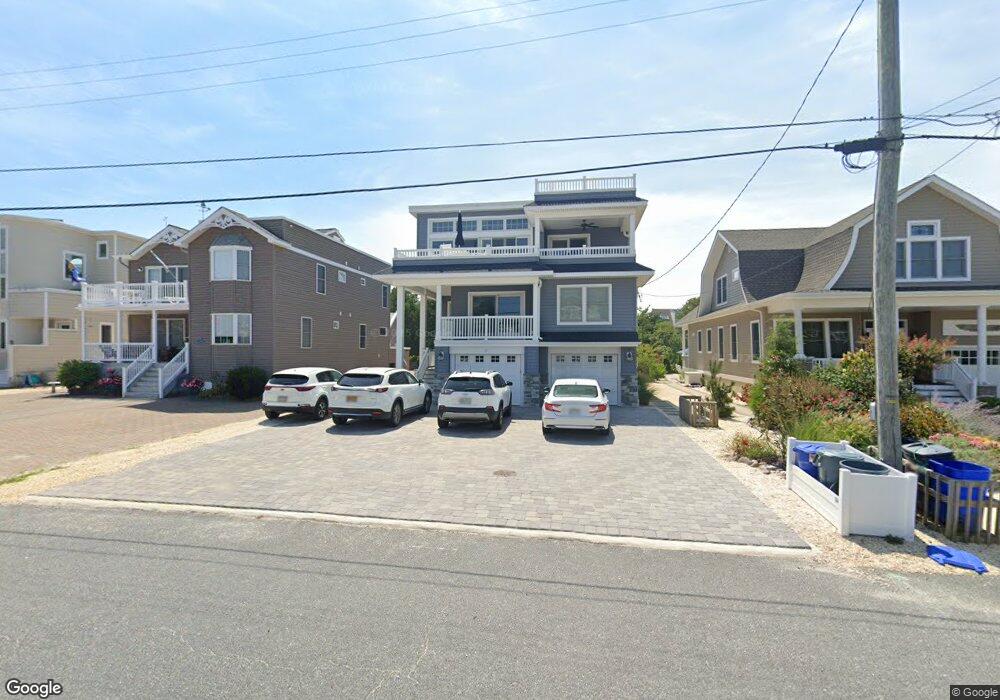
11 E 24th St Barnegat Light, NJ 08006
Long Beach Island NeighborhoodEstimated Value: $1,263,000 - $1,737,459
3
Beds
2
Baths
940
Sq Ft
$1,682/Sq Ft
Est. Value
About This Home
This home is located at 11 E 24th St, Barnegat Light, NJ 08006 and is currently estimated at $1,581,365, approximately $1,682 per square foot. 11 E 24th St is a home with nearby schools including Ethel A. Jacobsen Elementary School, Long Beach Island Grade School, and Southern Regional Middle School.
Ownership History
Date
Name
Owned For
Owner Type
Purchase Details
Closed on
Feb 12, 2016
Sold by
Stalnecker Stewart G and Stalnecker Shirley
Bought by
Greenfield Scott and Greenfield Rachel
Current Estimated Value
Home Financials for this Owner
Home Financials are based on the most recent Mortgage that was taken out on this home.
Original Mortgage
$621,000
Outstanding Balance
$492,463
Interest Rate
3.79%
Mortgage Type
New Conventional
Estimated Equity
$1,088,902
Purchase Details
Closed on
Dec 7, 1992
Bought by
Stalnecker Stewart G
Create a Home Valuation Report for This Property
The Home Valuation Report is an in-depth analysis detailing your home's value as well as a comparison with similar homes in the area
Home Values in the Area
Average Home Value in this Area
Purchase History
| Date | Buyer | Sale Price | Title Company |
|---|---|---|---|
| Greenfield Scott | $690,000 | Fidelity National Title | |
| Stalnecker Stewart G | -- | -- |
Source: Public Records
Mortgage History
| Date | Status | Borrower | Loan Amount |
|---|---|---|---|
| Open | Greenfield Scott | $621,000 |
Source: Public Records
Tax History
| Year | Tax Paid | Tax Assessment Tax Assessment Total Assessment is a certain percentage of the fair market value that is determined by local assessors to be the total taxable value of land and additions on the property. | Land | Improvement |
|---|---|---|---|---|
| 2025 | $10,886 | $1,080,000 | $575,000 | $505,000 |
| 2024 | $9,623 | $1,080,000 | $575,000 | $505,000 |
Source: Public Records
Map
Nearby Homes
- 2402 Central Ave
- 2006 Central Ave
- 4 E 20th St
- 11 E 30th St
- 10 E 18th St
- 171 Long Beach Blvd
- 41 W Holly Dr
- 2402-L Central Ave
- 2402 -L- Central Ave
- 43 W Holly Dr
- 24 Beacon Dr
- 29 Amherst Rd
- 34 Amherst Rd
- 46 Adrian Rd
- 3 W 12th St
- 6 Collier Rd
- 129 Long Beach Blvd
- 128 Long Beach Blvd
- 704 Broadway
- 26 Butler Rd
Your Personal Tour Guide
Ask me questions while you tour the home.