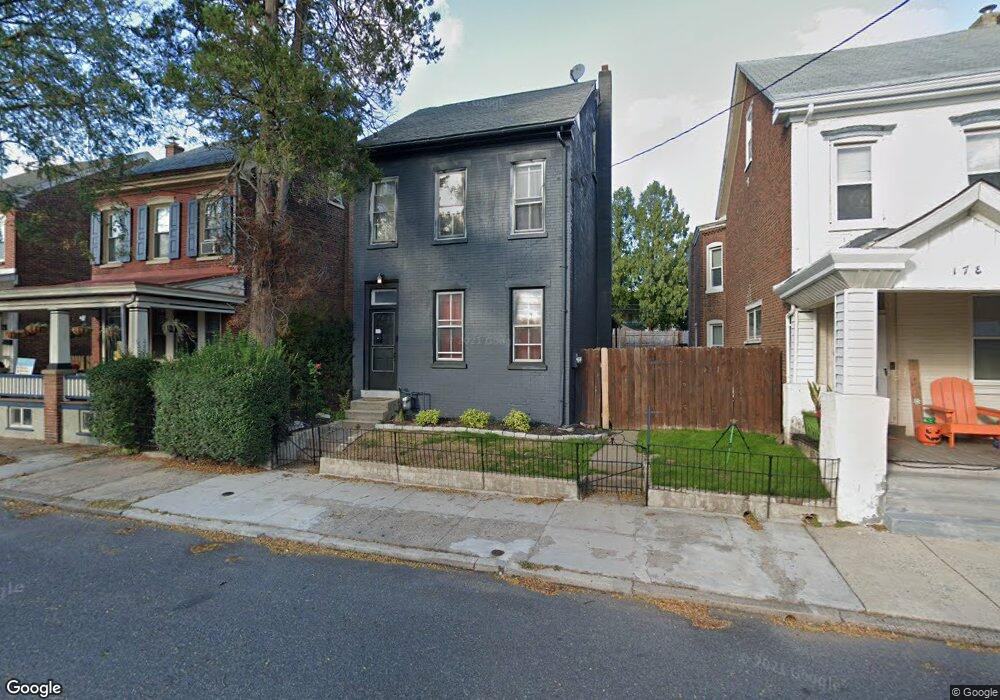
11 E 3rd St Pottstown, PA 19464
Manatawny-Farmington NeighborhoodEstimated Value: $237,000 - $305,000
3
Beds
3
Baths
2,316
Sq Ft
$117/Sq Ft
Est. Value
About This Home
This home is located at 11 E 3rd St, Pottstown, PA 19464 and is currently estimated at $271,051, approximately $117 per square foot. 11 E 3rd St is a home located in Montgomery County with nearby schools including Pottstown Middle School, Pottstown Senior High School, and West-Mont Christian Academy.
Ownership History
Date
Name
Owned For
Owner Type
Purchase Details
Closed on
May 23, 2008
Sold by
Mancini Deborah and Mancini Patrick D
Bought by
Rose Elisa C and Rose Raymond M
Current Estimated Value
Home Financials for this Owner
Home Financials are based on the most recent Mortgage that was taken out on this home.
Original Mortgage
$147,555
Outstanding Balance
$94,564
Interest Rate
6.11%
Estimated Equity
$176,487
Purchase Details
Closed on
Feb 20, 1998
Sold by
Mancini Patrick and Mancini Patrick D
Bought by
Mancini Patrick D and Mancini Deborah
Create a Home Valuation Report for This Property
The Home Valuation Report is an in-depth analysis detailing your home's value as well as a comparison with similar homes in the area
Home Values in the Area
Average Home Value in this Area
Purchase History
| Date | Buyer | Sale Price | Title Company |
|---|---|---|---|
| Rose Elisa C | $163,950 | None Available | |
| Mancini Patrick D | -- | -- |
Source: Public Records
Mortgage History
| Date | Status | Borrower | Loan Amount |
|---|---|---|---|
| Open | Rose Elisa C | $147,555 |
Source: Public Records
Tax History
| Year | Tax Paid | Tax Assessment Tax Assessment Total Assessment is a certain percentage of the fair market value that is determined by local assessors to be the total taxable value of land and additions on the property. | Land | Improvement |
|---|---|---|---|---|
| 2025 | $5,087 | $82,890 | $31,120 | $51,770 |
| 2024 | $5,087 | $82,890 | $31,120 | $51,770 |
| 2023 | $5,018 | $82,890 | $31,120 | $51,770 |
| 2022 | $4,992 | $82,890 | $31,120 | $51,770 |
| 2021 | $4,935 | $82,890 | $31,120 | $51,770 |
| 2020 | $4,848 | $82,890 | $31,120 | $51,770 |
| 2019 | $4,737 | $82,890 | $31,120 | $51,770 |
Source: Public Records
Map
Nearby Homes
Your Personal Tour Guide
Ask me questions while you tour the home.