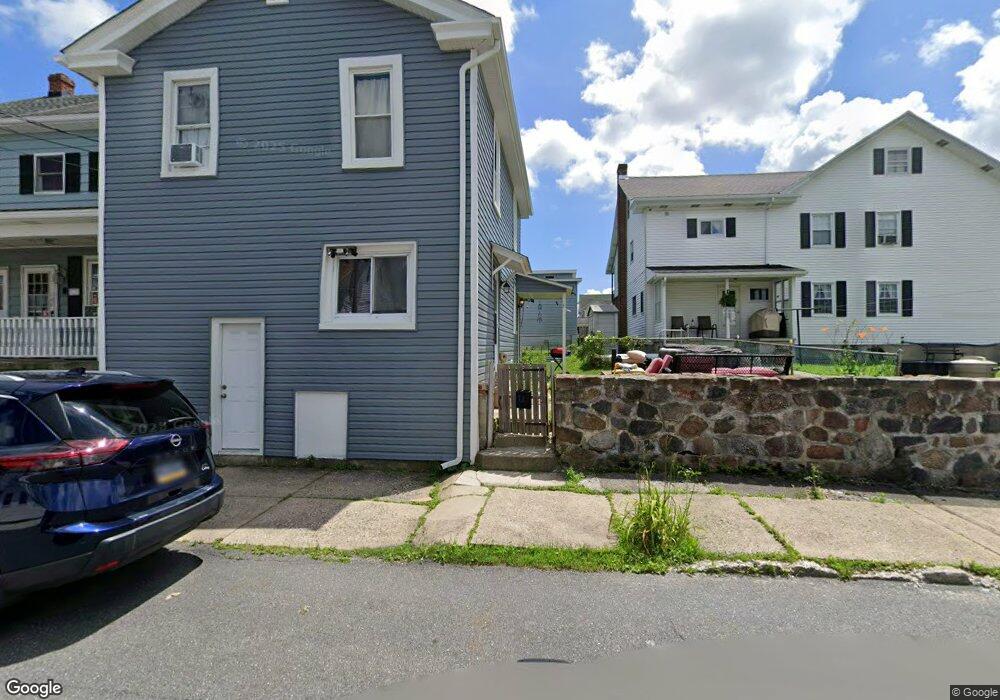
11 E Fell St Summit Hill, PA 18250
Estimated Value: $74,560 - $144,000
3
Beds
1
Bath
1,227
Sq Ft
$89/Sq Ft
Est. Value
About This Home
This home is located at 11 E Fell St, Summit Hill, PA 18250 and is currently estimated at $109,140, approximately $88 per square foot. 11 E Fell St is a home located in Carbon County with nearby schools including Panther Valley Intermediate School, Panther Valley Elementary School, and Panther Valley Junior/Senior High School.
Ownership History
Date
Name
Owned For
Owner Type
Purchase Details
Closed on
Aug 7, 2006
Sold by
Argott Philip W and Faneza Rosalie K
Bought by
Kalfus Jonathan L and Kalfus Shannon
Current Estimated Value
Home Financials for this Owner
Home Financials are based on the most recent Mortgage that was taken out on this home.
Original Mortgage
$51,500
Outstanding Balance
$36,158
Interest Rate
10.15%
Mortgage Type
Adjustable Rate Mortgage/ARM
Estimated Equity
$72,982
Create a Home Valuation Report for This Property
The Home Valuation Report is an in-depth analysis detailing your home's value as well as a comparison with similar homes in the area
Home Values in the Area
Average Home Value in this Area
Purchase History
| Date | Buyer | Sale Price | Title Company |
|---|---|---|---|
| Kalfus Jonathan L | $51,500 | None Available |
Source: Public Records
Mortgage History
| Date | Status | Borrower | Loan Amount |
|---|---|---|---|
| Open | Kalfus Jonathan L | $51,500 |
Source: Public Records
Tax History
| Year | Tax Paid | Tax Assessment Tax Assessment Total Assessment is a certain percentage of the fair market value that is determined by local assessors to be the total taxable value of land and additions on the property. | Land | Improvement |
|---|---|---|---|---|
| 2025 | $1,239 | $13,050 | $5,300 | $7,750 |
| 2024 | $1,263 | $13,050 | $5,300 | $7,750 |
| 2023 | $1,244 | $13,050 | $5,300 | $7,750 |
| 2022 | $1,255 | $13,050 | $5,300 | $7,750 |
| 2021 | $1,255 | $13,050 | $5,300 | $7,750 |
| 2020 | $1,245 | $13,050 | $5,300 | $7,750 |
| 2019 | $1,155 | $13,050 | $5,300 | $7,750 |
| 2018 | $1,136 | $13,050 | $5,300 | $7,750 |
| 2017 | $1,123 | $13,050 | $5,300 | $7,750 |
| 2016 | -- | $13,050 | $5,300 | $7,750 |
| 2015 | -- | $13,050 | $5,300 | $7,750 |
| 2014 | -- | $13,050 | $5,300 | $7,750 |
Source: Public Records
Map
Nearby Homes
- 24 W Fell St
- 239 E Hazard St
- 103 E Amidon St
- 310 E Ludlow St
- 415 W White St
- 260 E Abbott St
- 253 E Abbott St
- 601 E Bertsch St
- 301 E Bertsch St
- 265-267 E Bertsch St
- 627 E Patterson St
- 421 E Patterson St
- 212 E Kline Ave
- 239 E Patterson St
- 308 E Snyder Ave
- 221 E Patterson St
- 624 E Front St
- 231-233 E Ridge St
- 217 E Ridge St
- 215 E Ridge St
Your Personal Tour Guide
Ask me questions while you tour the home.