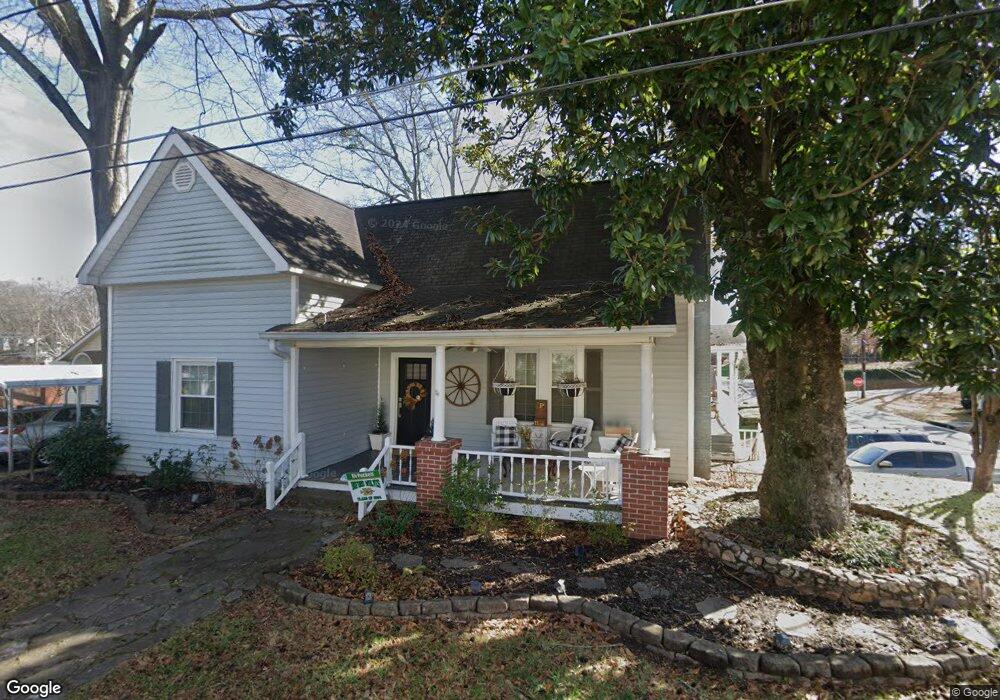
11 E Park St Buford, GA 30518
Estimated Value: $399,000 - $455,000
2
Beds
1
Bath
2,223
Sq Ft
$192/Sq Ft
Est. Value
About This Home
This home is located at 11 E Park St, Buford, GA 30518 and is currently estimated at $425,764, approximately $191 per square foot. 11 E Park St is a home located in Gwinnett County with nearby schools including Buford Elementary School, Buford Senior Academy, and Buford Academy.
Ownership History
Date
Name
Owned For
Owner Type
Purchase Details
Closed on
Jun 7, 2004
Sold by
Kennedy William B and Kennedy Diana
Bought by
Puckett Joshua S
Current Estimated Value
Home Financials for this Owner
Home Financials are based on the most recent Mortgage that was taken out on this home.
Original Mortgage
$29,400
Outstanding Balance
$14,143
Interest Rate
5.98%
Mortgage Type
Unknown
Estimated Equity
$411,621
Purchase Details
Closed on
Aug 28, 2002
Sold by
Kennedy William B
Bought by
Kennedy William B and Kennedy Diana L
Home Financials for this Owner
Home Financials are based on the most recent Mortgage that was taken out on this home.
Original Mortgage
$120,450
Interest Rate
6.31%
Mortgage Type
FHA
Purchase Details
Closed on
Jun 29, 1995
Sold by
Pass Kenneth C
Bought by
Watts Jimmy Teresa B
Create a Home Valuation Report for This Property
The Home Valuation Report is an in-depth analysis detailing your home's value as well as a comparison with similar homes in the area
Home Values in the Area
Average Home Value in this Area
Purchase History
| Date | Buyer | Sale Price | Title Company |
|---|---|---|---|
| Puckett Joshua S | $147,000 | -- | |
| Kennedy William B | -- | -- | |
| Kennedy William B | $122,400 | -- | |
| Watts Jimmy Teresa B | $80,000 | -- |
Source: Public Records
Mortgage History
| Date | Status | Borrower | Loan Amount |
|---|---|---|---|
| Open | Puckett Joshua S | $29,400 | |
| Open | Puckett Joshua S | $117,600 | |
| Previous Owner | Kennedy William B | $120,450 |
Source: Public Records
Tax History
| Year | Tax Paid | Tax Assessment Tax Assessment Total Assessment is a certain percentage of the fair market value that is determined by local assessors to be the total taxable value of land and additions on the property. | Land | Improvement |
|---|---|---|---|---|
| 2025 | $504 | $161,240 | $40,000 | $121,240 |
| 2024 | $504 | $162,080 | $33,600 | $128,480 |
| 2023 | $504 | $122,000 | $26,000 | $96,000 |
| 2022 | $504 | $122,000 | $26,000 | $96,000 |
| 2021 | $504 | $75,480 | $16,800 | $58,680 |
| 2020 | $504 | $75,480 | $16,800 | $58,680 |
| 2019 | $455 | $75,480 | $16,800 | $58,680 |
| 2018 | $455 | $45,840 | $5,600 | $40,240 |
| 2016 | $452 | $45,840 | $5,600 | $40,240 |
| 2015 | $469 | $45,840 | $5,600 | $40,240 |
| 2014 | $449 | $42,800 | $5,600 | $37,200 |
Source: Public Records
Map
Nearby Homes
- 185 Scott St
- 0 E Moreno St
- 460 Espy St
- 76 W Moreno St
- 425 Church St
- 449 S Hill St
- 120 N Gwinnett St
- 585 Briard Dr
- 1769 Rowland Pass
- 294 Watson St
- 2020 Harvester Ln
- 7307 William St
- 151 N Church St
- 550 Gwinnett St
- 2258 Seed Way
- 490 Jackson St
- 669 Leather St
- 1966 Sterling Park
- 225 Smokey Rd
- 570 Power Ave
Your Personal Tour Guide
Ask me questions while you tour the home.