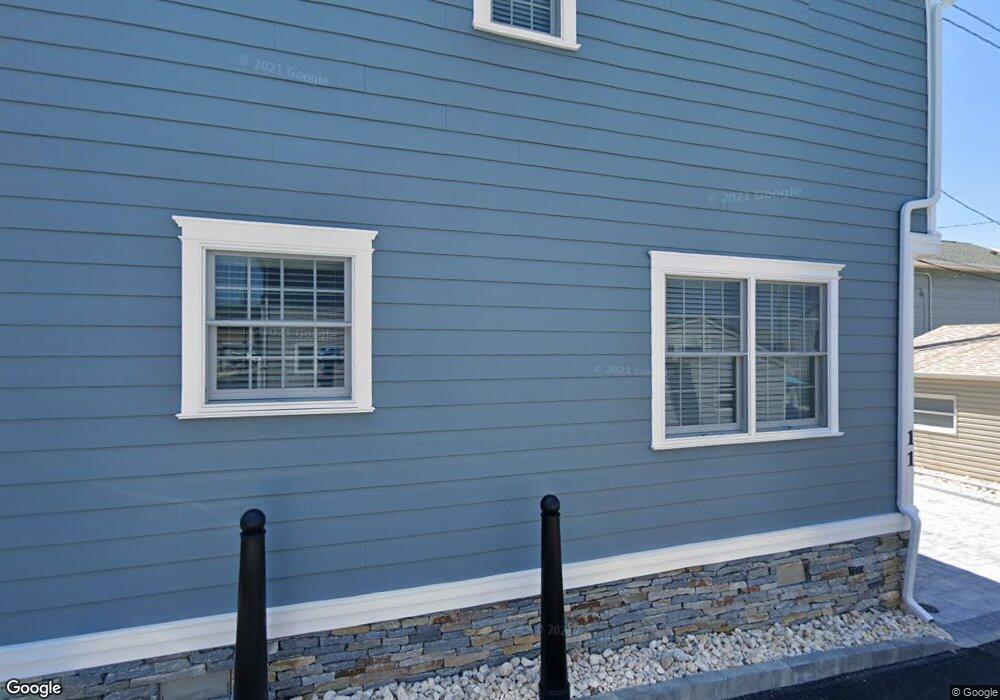
11 E Surf Way Lavallette, NJ 08735
Dover Beaches North NeighborhoodEstimated Value: $731,000 - $1,093,000
3
Beds
3
Baths
1,280
Sq Ft
$717/Sq Ft
Est. Value
About This Home
This home is located at 11 E Surf Way, Lavallette, NJ 08735 and is currently estimated at $917,832, approximately $717 per square foot. 11 E Surf Way is a home located in Ocean County.
Ownership History
Date
Name
Owned For
Owner Type
Purchase Details
Closed on
Oct 14, 2010
Sold by
Fleischer Patricia A
Bought by
Leeder James and Leeder Valerie
Current Estimated Value
Home Financials for this Owner
Home Financials are based on the most recent Mortgage that was taken out on this home.
Original Mortgage
$399,000
Outstanding Balance
$263,566
Interest Rate
4.37%
Mortgage Type
New Conventional
Estimated Equity
$654,266
Purchase Details
Closed on
Apr 18, 2000
Sold by
Santi Frank Delli
Bought by
Fleischer Richard and Fleischer Patricia
Home Financials for this Owner
Home Financials are based on the most recent Mortgage that was taken out on this home.
Original Mortgage
$141,600
Interest Rate
8.21%
Mortgage Type
Purchase Money Mortgage
Purchase Details
Closed on
Sep 7, 1993
Sold by
Gray Albert D
Bought by
Santi Frank Delli and Santi Karen Delli
Home Financials for this Owner
Home Financials are based on the most recent Mortgage that was taken out on this home.
Original Mortgage
$100,000
Interest Rate
7.16%
Mortgage Type
Purchase Money Mortgage
Create a Home Valuation Report for This Property
The Home Valuation Report is an in-depth analysis detailing your home's value as well as a comparison with similar homes in the area
Home Values in the Area
Average Home Value in this Area
Purchase History
| Date | Buyer | Sale Price | Title Company |
|---|---|---|---|
| Leeder James | $499,000 | None Available | |
| Fleischer Richard | $177,000 | -- | |
| Santi Frank Delli | $135,000 | -- |
Source: Public Records
Mortgage History
| Date | Status | Borrower | Loan Amount |
|---|---|---|---|
| Open | Leeder James | $399,000 | |
| Previous Owner | Fleischer Richard | $141,600 | |
| Previous Owner | Santi Frank Delli | $100,000 |
Source: Public Records
Tax History
| Year | Tax Paid | Tax Assessment Tax Assessment Total Assessment is a certain percentage of the fair market value that is determined by local assessors to be the total taxable value of land and additions on the property. | Land | Improvement |
|---|---|---|---|---|
| 2025 | $12,355 | $632,300 | $304,000 | $328,300 |
| 2024 | $10,945 | $632,300 | $304,000 | $328,300 |
| 2023 | $10,520 | $632,300 | $304,000 | $328,300 |
| 2022 | $10,520 | $630,300 | $304,000 | $326,300 |
| 2021 | $7,581 | $220,500 | $220,500 | $0 |
| 2020 | $6,948 | $278,600 | $220,500 | $58,100 |
| 2019 | $6,647 | $278,600 | $220,500 | $58,100 |
| 2018 | $6,558 | $278,600 | $220,500 | $58,100 |
| 2017 | $6,503 | $278,600 | $220,500 | $58,100 |
| 2016 | $6,333 | $278,600 | $220,500 | $58,100 |
| 2015 | $6,093 | $278,600 | $220,500 | $58,100 |
| 2014 | $5,800 | $278,600 | $220,500 | $58,100 |
Source: Public Records
Map
Nearby Homes
- 75 Grand Central Ave Unit Courtyard
- 75 Grand Central Ave Unit Private Side Yard
- 3031 Route 35 N Unit B
- 3071 Route 35 S Unit B1U7
- 63 E Rutherford Ln
- 10 W Rutherford Ln
- 12 W Rutherford Ln
- 34 W Rutherford Ln
- 18 Coronado Rd
- 3071 Route35sb-B1-u7 Unit 7
- 304 Ocean Ave
- 207 Bay Blvd
- 105 W Bayberry Way
- 236 Bryn Mawr Ave
- 21 E Dune Way Unit 121
- 201 Mallard Ln
- 3201 Route 35 N Unit B
- 208 Mallard Ln
- 109 President Ave
- 111 President Ave
- 10 E Shore Way
- 10 E Surf Way
- 13 E Surf Way
- 12 E Shore Way
- 12 E Surf Way
- 11 E Shore Way
- 3025 Ocean Rd
- 13 E Spray Way
- 3010 Ocean Rd
- 3016 Ocean Rd
- 13 E Shore Way
- 3006 Ocean Rd
- 3006 Ocean Rd Unit SUMMER RENTAL
- 15 E Surf Way
- 14 E Shore Way
- 3020 Ocean Rd
- 14 E Surf Way
- 3000 Ocean Rd
- 10 E Spray Way
- 15 E Spray Way
Your Personal Tour Guide
Ask me questions while you tour the home.