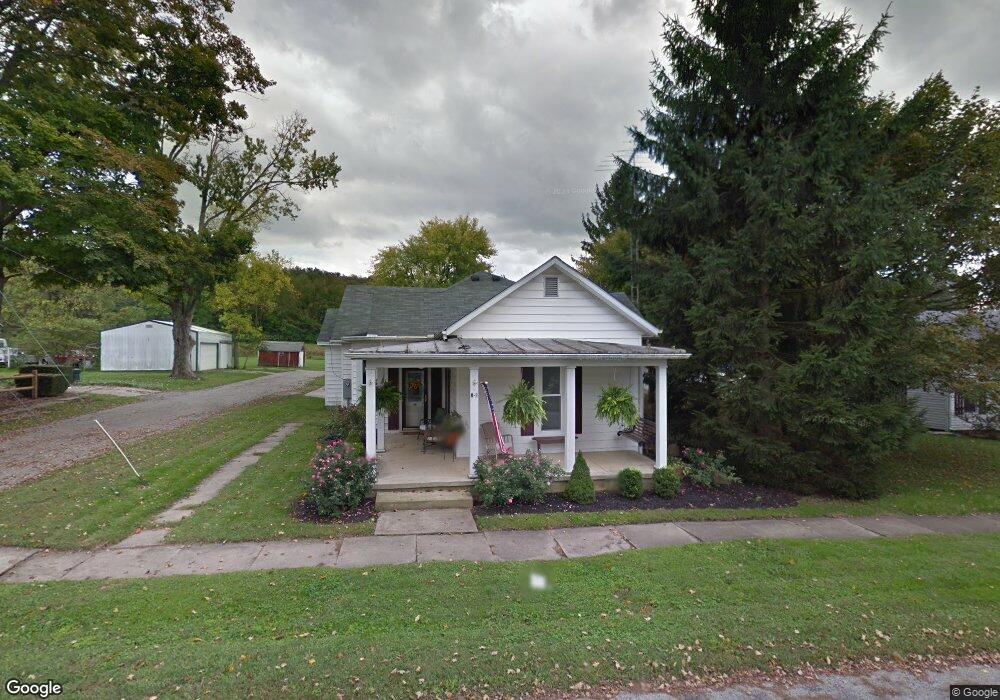
11 E Walnut St Spring Valley, OH 45370
Estimated Value: $222,277 - $273,000
2
Beds
2
Baths
1,808
Sq Ft
$138/Sq Ft
Est. Value
About This Home
This home is located at 11 E Walnut St, Spring Valley, OH 45370 and is currently estimated at $249,319, approximately $137 per square foot. 11 E Walnut St is a home located in Greene County with nearby schools including Xenia High School.
Ownership History
Date
Name
Owned For
Owner Type
Purchase Details
Closed on
Oct 20, 2020
Sold by
Bordewisch Dawn E
Bought by
Carmack Danies
Current Estimated Value
Home Financials for this Owner
Home Financials are based on the most recent Mortgage that was taken out on this home.
Original Mortgage
$169,159
Outstanding Balance
$148,452
Interest Rate
2.8%
Mortgage Type
FHA
Estimated Equity
$100,867
Purchase Details
Closed on
Oct 7, 2020
Sold by
Bordewisch Dawn E
Bought by
Carmack Daniel
Home Financials for this Owner
Home Financials are based on the most recent Mortgage that was taken out on this home.
Original Mortgage
$169,159
Outstanding Balance
$148,452
Interest Rate
2.8%
Mortgage Type
FHA
Estimated Equity
$100,867
Purchase Details
Closed on
Jul 25, 2017
Sold by
Atchison Joyce A and Bordewisch Dawn E
Bought by
Bordewisch Dawn E
Home Financials for this Owner
Home Financials are based on the most recent Mortgage that was taken out on this home.
Original Mortgage
$142,500
Interest Rate
3.88%
Mortgage Type
New Conventional
Purchase Details
Closed on
Dec 11, 1992
Bought by
Atchison Joyce A
Create a Home Valuation Report for This Property
The Home Valuation Report is an in-depth analysis detailing your home's value as well as a comparison with similar homes in the area
Purchase History
| Date | Buyer | Sale Price | Title Company |
|---|---|---|---|
| Carmack Danies | -- | None Listed On Document | |
| Carmack Daniel | $175,000 | None Available | |
| Bordewisch Dawn E | $150,000 | None Available | |
| Atchison Joyce A | $69,000 | -- |
Source: Public Records
Mortgage History
| Date | Status | Borrower | Loan Amount |
|---|---|---|---|
| Open | Carmack Danies | $169,159 | |
| Closed | Carmack Daniel | $169,159 | |
| Previous Owner | Bordewisch Dawn E | $142,500 |
Source: Public Records
Tax History
| Year | Tax Paid | Tax Assessment Tax Assessment Total Assessment is a certain percentage of the fair market value that is determined by local assessors to be the total taxable value of land and additions on the property. | Land | Improvement |
|---|---|---|---|---|
| 2025 | $3,688 | $67,070 | $6,850 | $60,220 |
| 2024 | $3,688 | $67,070 | $6,850 | $60,220 |
| 2023 | $3,661 | $67,070 | $6,850 | $60,220 |
| 2022 | $3,103 | $48,990 | $5,710 | $43,280 |
| 2021 | $3,136 | $48,990 | $5,710 | $43,280 |
| 2020 | $2,951 | $48,990 | $5,710 | $43,280 |
| 2019 | $2,419 | $37,420 | $4,790 | $32,630 |
| 2018 | $2,389 | $37,420 | $4,790 | $32,630 |
| 2017 | $2,241 | $37,420 | $4,790 | $32,630 |
| 2016 | $2,203 | $35,870 | $4,790 | $31,080 |
| 2015 | $2,208 | $35,870 | $4,790 | $31,080 |
| 2014 | $2,128 | $35,870 | $4,790 | $31,080 |
Source: Public Records
Map
Nearby Homes
- 196 Mound St
- 2471 Lower Bellbrook Rd
- 2644 Center Creek Cir
- 1587 W Spring Valley Painters Rd
- Lot 1 - 3708 Penewit Rd
- 3435 State Route 380
- 3435 Ohio 380
- Lot 2 Mount Holly Rd
- 1068 Hedges Rd
- 364 W Krepps Rd
- 2488 Stewart Rd
- 2934 Bristol Dr
- 2928 Bristol Dr
- 1253 Baybury Ave
- 1298 Baybury Ave
- 1282 Baybury Ave
- 1265 Baybury Ave
- 1317 Baybury Ave
- 1299 Baybury Ave
- 1694 Mcclellan Rd
Your Personal Tour Guide
Ask me questions while you tour the home.