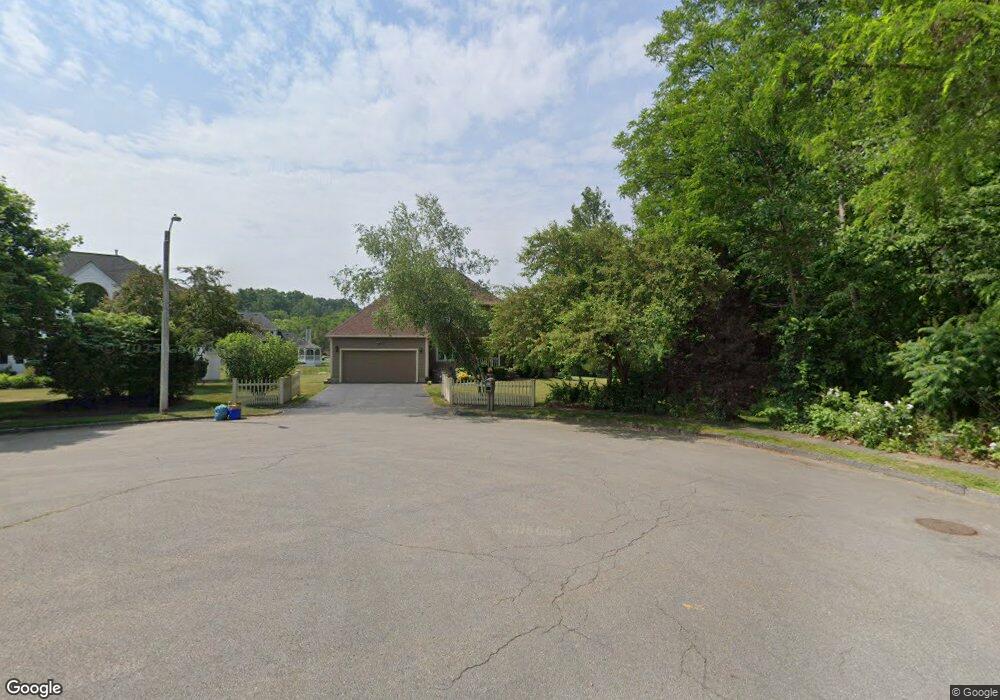
11 Egret Cir Shrewsbury, MA 01545
Estimated Value: $879,000 - $990,000
4
Beds
3
Baths
2,371
Sq Ft
$384/Sq Ft
Est. Value
About This Home
This home is located at 11 Egret Cir, Shrewsbury, MA 01545 and is currently estimated at $910,381, approximately $383 per square foot. 11 Egret Cir is a home located in Worcester County with nearby schools including Sherwood Middle School, Calvin Coolidge Elementary School, and Oak Middle School.
Ownership History
Date
Name
Owned For
Owner Type
Purchase Details
Closed on
May 16, 2017
Sold by
Maruca Sheila A
Bought by
Maruca Christine and Maruca-Hoak Deborah
Current Estimated Value
Purchase Details
Closed on
Feb 19, 2013
Sold by
Beliske Donald L and Maruca Sheila A
Bought by
Maruca Sheila A
Home Financials for this Owner
Home Financials are based on the most recent Mortgage that was taken out on this home.
Original Mortgage
$255,425
Interest Rate
3.38%
Mortgage Type
Stand Alone Refi Refinance Of Original Loan
Purchase Details
Closed on
Jan 9, 1996
Sold by
Ternberry Dev Corp
Bought by
Robo Properties Ltd
Purchase Details
Closed on
Dec 21, 1994
Sold by
Robo Properties Ltd
Bought by
Belisle Doanld and Maruca Sheila
Create a Home Valuation Report for This Property
The Home Valuation Report is an in-depth analysis detailing your home's value as well as a comparison with similar homes in the area
Home Values in the Area
Average Home Value in this Area
Purchase History
| Date | Buyer | Sale Price | Title Company |
|---|---|---|---|
| Maruca Christine | -- | -- | |
| Maruca Christine | -- | -- | |
| Maruca Christine | -- | -- | |
| Maruca Sheila A | -- | -- | |
| Maruca Sheila A | -- | -- | |
| Maruca Sheila A | -- | -- | |
| Robo Properties Ltd | $60,000 | -- | |
| Robo Properties Ltd | $60,000 | -- | |
| Belisle Doanld | $223,770 | -- | |
| Robo Properties Ltd | $60,000 | -- | |
| Belisle Doanld | $223,770 | -- |
Source: Public Records
Mortgage History
| Date | Status | Borrower | Loan Amount |
|---|---|---|---|
| Previous Owner | Maruca Sheila A | $255,425 |
Source: Public Records
Tax History Compared to Growth
Tax History
| Year | Tax Paid | Tax Assessment Tax Assessment Total Assessment is a certain percentage of the fair market value that is determined by local assessors to be the total taxable value of land and additions on the property. | Land | Improvement |
|---|---|---|---|---|
| 2025 | $92 | $767,600 | $276,400 | $491,200 |
| 2024 | $9,309 | $751,900 | $263,200 | $488,700 |
| 2023 | $8,691 | $662,400 | $263,200 | $399,200 |
| 2022 | $8,005 | $567,300 | $234,000 | $333,300 |
| 2021 | $6,693 | $507,400 | $234,000 | $273,400 |
| 2020 | $6,145 | $492,800 | $234,000 | $258,800 |
| 2019 | $5,975 | $475,300 | $222,900 | $252,400 |
| 2018 | $6,289 | $496,800 | $203,700 | $293,100 |
| 2017 | $6,128 | $477,600 | $184,500 | $293,100 |
| 2016 | $5,889 | $453,000 | $172,500 | $280,500 |
| 2015 | $5,036 | $381,500 | $143,100 | $238,400 |
Source: Public Records
Map
Nearby Homes
- 10 Crane Cir
- 15 Eagle Dr
- 7 Tern Dr
- 40 Phillips Ave
- 5 Fyrbeck Ave
- 15 Eaglehead Terrace Unit 2
- 15 Eaglehead Terrace Unit 5
- 19 Eaglehead Terrace Unit 2
- 19 Eaglehead Terrace Unit 4
- 163 N Lake Ave Unit A
- 163 N Lake Ave
- 67 N Quinsigamond Ave Unit 23
- 190 Dominion Rd
- 46 Dominion Rd
- 6 Selina St
- 46 N Quinsigamond Ave
- 5A Wigwam Hill Dr Unit A
- 64 Wauwinet Rd
- 14 Minuteman Way
- 1 Temple Ct