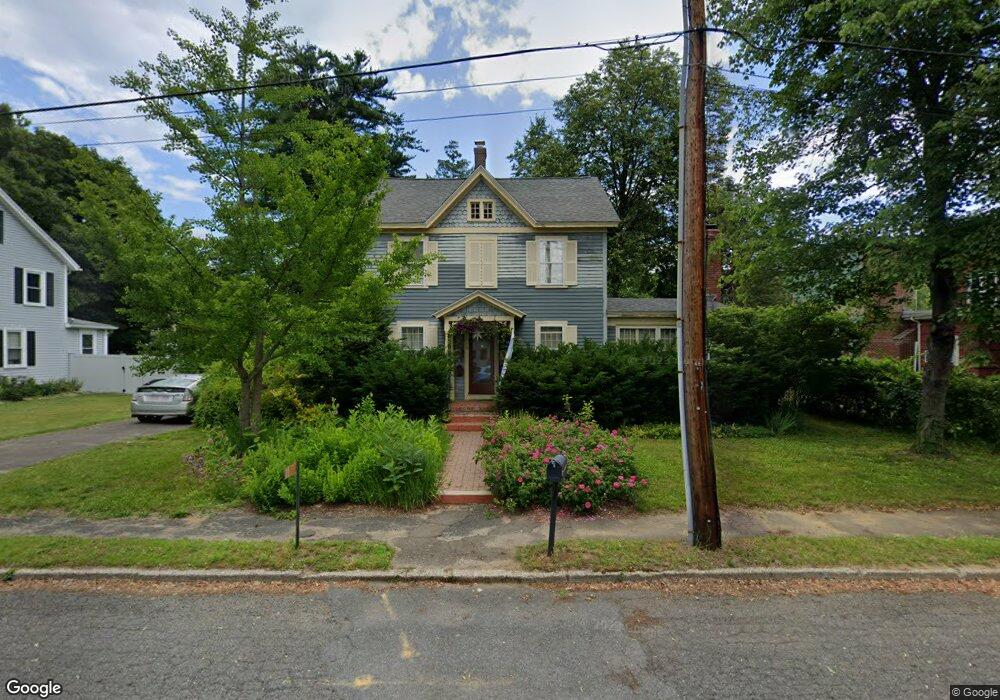
11 Elliot St Easthampton, MA 01027
Estimated Value: $433,000 - $586,000
About This Home
This home is located at 11 Elliot St, Easthampton, MA 01027 and is currently estimated at $475,686, approximately $254 per square foot. 11 Elliot St is a home located in Hampshire County with nearby schools including Easthampton High School, Tri-County Schools, and New England Adolescent Research Institute.
Ownership History
We collect this data history from publicly available records. To have your information removed, we recommend requesting removal directly through your county’s website.
Purchase Details
Purchase Details
Home Financials for this Owner
Home Financials are based on the most recent Mortgage that was taken out on this home.Home Values in the Area
Average Home Value in this Area
Purchase History
We collect this data history from publicly available records. To have your information removed, we recommend requesting removal directly through your county’s website.
| Date | Buyer | Sale Price | Title Company |
|---|---|---|---|
| -- | -- | ||
| -- | -- | ||
| $148,000 | -- | ||
| $148,000 | -- |
Mortgage History
We collect this data history from publicly available records. To have your information removed, we recommend requesting removal directly through your county’s website.
| Date | Status | Borrower | Loan Amount |
|---|---|---|---|
| Previous Owner | $25,000 | ||
| Previous Owner | $123,600 | ||
| Previous Owner | $133,200 |
Tax History
We collect this data history from publicly available records. To have your information removed, we recommend requesting removal directly through your county’s website.
| Year | Tax Paid | Tax Assessment Tax Assessment Total Assessment is a certain percentage of the fair market value that is determined by local assessors to be the total taxable value of land and additions on the property. | Land | Improvement |
|---|---|---|---|---|
| 2025 | $4,927 | $360,400 | $107,600 | $252,800 |
| 2024 | $4,751 | $350,400 | $104,400 | $246,000 |
| 2023 | $3,604 | $246,000 | $82,200 | $163,800 |
| 2022 | $4,066 | $246,000 | $82,200 | $163,800 |
| 2021 | $4,464 | $254,500 | $82,200 | $172,300 |
| 2020 | $4,369 | $246,000 | $82,200 | $163,800 |
| 2019 | $3,749 | $242,500 | $82,200 | $160,300 |
| 2018 | $3,624 | $226,500 | $77,600 | $148,900 |
| 2017 | $3,540 | $218,400 | $74,600 | $143,800 |
| 2016 | $3,717 | $238,400 | $74,600 | $163,800 |
| 2015 | $3,612 | $238,400 | $74,600 | $163,800 |
Map
- 52-54 Holyoke St
- 27 Holyoke St
- 26 Mount Tom Ave
- 64 Mount Tom Ave
- 14 Holyoke St
- 17 Olympia St
- 52 Knipfer Ave
- 123 Holyoke St
- 17 Adams St
- 85 Garfield Ave
- 28 Winter St Unit 28
- 6 Valley Ln
- 74 Parsons St
- 22 Maine Ave Unit 22
- 64-66 Pleasant St
- 12 Greenwood Ct
- 55 South St
- 21 Holly Cir
- 20 Meadowbrook Dr
- 10 Robin Rd
Ask me questions while you tour the home.