Estimated Value: $127,167 - $205,000
Studio
3
Baths
3,024
Sq Ft
$54/Sq Ft
Est. Value
About This Home
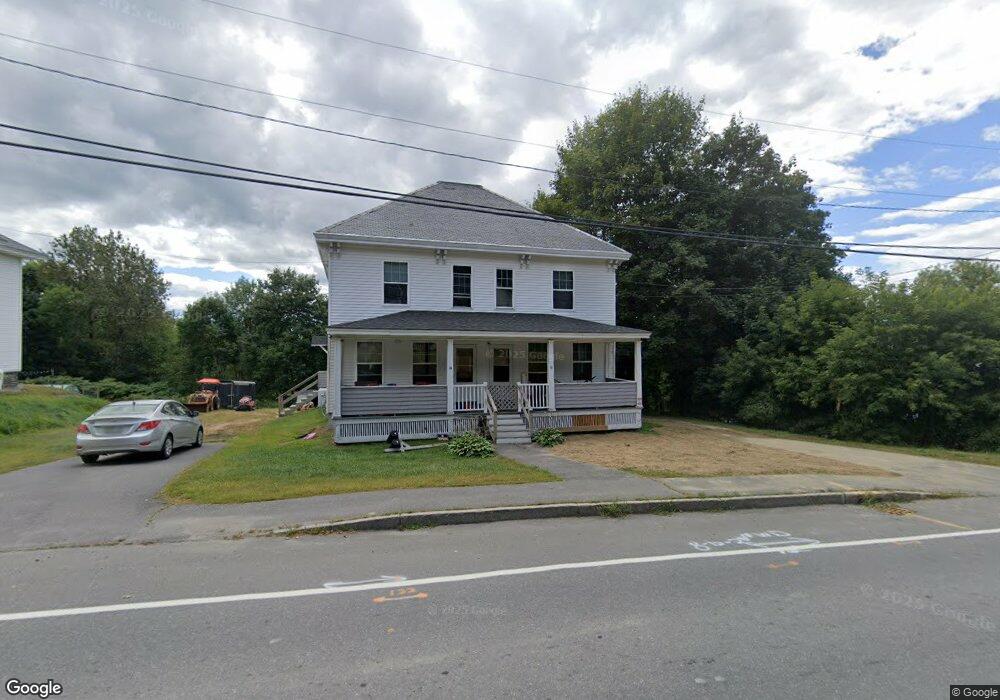
This home is located at 11 Elm St, Milo, ME 04463 and is currently estimated at $164,292, approximately $54 per square foot. 11 Elm St is a home located in Piscataquis County with nearby schools including Milo Elementary School, Penquis Valley High School, and Brownville Elementary School.
Ownership History
Date
Name
Owned For
Owner Type
Purchase Details
Closed on
Aug 27, 2018
Sold by
Rayne Michael J
Bought by
Rayne Michael J and Gilbert Jean
Current Estimated Value
Home Financials for this Owner
Home Financials are based on the most recent Mortgage that was taken out on this home.
Original Mortgage
$60,000
Outstanding Balance
$51,781
Interest Rate
4.5%
Mortgage Type
New Conventional
Estimated Equity
$112,511
Purchase Details
Closed on
Jun 25, 2014
Sold by
Ettinger Melissa J
Bought by
Federal National Mortgage Association
Purchase Details
Closed on
Nov 22, 2006
Sold by
Ettinger Melissa J
Bought by
Allen Jason C
Purchase Details
Closed on
Jun 8, 2005
Sold by
Nimick Marc E and Nimick Emily A
Bought by
Ettinger Melissa J
Home Financials for this Owner
Home Financials are based on the most recent Mortgage that was taken out on this home.
Original Mortgage
$66,000
Interest Rate
5.79%
Mortgage Type
Commercial
Create a Home Valuation Report for This Property
The Home Valuation Report is an in-depth analysis detailing your home's value as well as a comparison with similar homes in the area
Purchase History
| Date | Buyer | Sale Price | Title Company |
|---|---|---|---|
| Rayne Michael J | -- | -- | |
| Federal National Mortgage Association | -- | -- | |
| Allen Jason C | -- | -- | |
| Ettinger Melissa J | -- | -- |
Source: Public Records
Mortgage History
| Date | Status | Borrower | Loan Amount |
|---|---|---|---|
| Open | Rayne Michael J | $60,000 | |
| Previous Owner | Ettinger Melissa J | $66,000 |
Source: Public Records
Tax History
| Year | Tax Paid | Tax Assessment Tax Assessment Total Assessment is a certain percentage of the fair market value that is determined by local assessors to be the total taxable value of land and additions on the property. | Land | Improvement |
|---|---|---|---|---|
| 2025 | $2,282 | $81,500 | $8,200 | $73,300 |
| 2024 | $2,221 | $81,500 | $8,200 | $73,300 |
| 2023 | $1,948 | $81,500 | $8,200 | $73,300 |
| 2022 | $2,115 | $81,500 | $8,200 | $73,300 |
| 2021 | $2,099 | $81,500 | $8,200 | $73,300 |
| 2020 | $2,367 | $85,300 | $8,700 | $76,600 |
| 2019 | $2,356 | $81,230 | $8,260 | $72,970 |
| 2018 | $2,538 | $81,230 | $8,260 | $72,970 |
| 2017 | $2,538 | $81,230 | $8,260 | $72,970 |
| 2016 | $2,640 | $81,230 | $8,260 | $72,970 |
| 2015 | $2,331 | $81,230 | $8,260 | $72,970 |
| 2014 | $2,471 | $116,030 | $11,800 | $104,230 |
Source: Public Records
Map
Nearby Homes
Your Personal Tour Guide
Ask me questions while you tour the home.