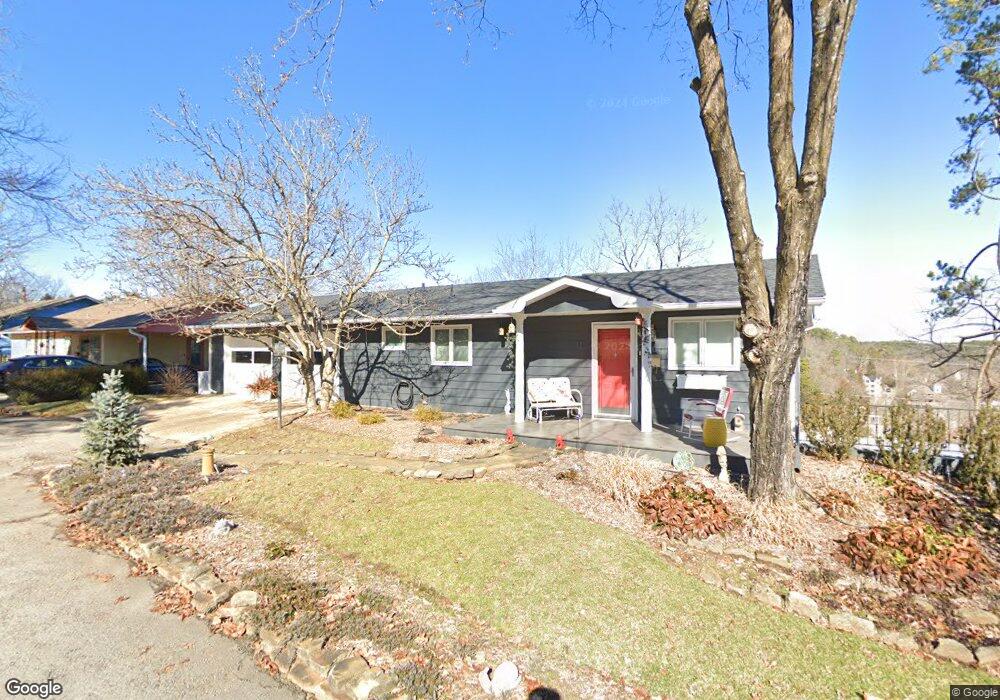
11 Eureka St Eureka Springs, AR 72632
Estimated Value: $343,000 - $550,000
2
Beds
2
Baths
1,018
Sq Ft
$419/Sq Ft
Est. Value
About This Home
This home is located at 11 Eureka St, Eureka Springs, AR 72632 and is currently estimated at $426,661, approximately $419 per square foot. 11 Eureka St is a home located in Carroll County with nearby schools including Eureka Springs Elementary School, Eureka Springs Middle School, and Eureka Springs High School.
Ownership History
Date
Name
Owned For
Owner Type
Purchase Details
Closed on
Oct 7, 2003
Sold by
Webster
Bought by
Vanwoy
Current Estimated Value
Purchase Details
Closed on
May 1, 2003
Sold by
Underwood
Bought by
Webster
Purchase Details
Closed on
Apr 1, 2002
Sold by
Harrison
Bought by
Underwood
Purchase Details
Closed on
May 16, 1997
Sold by
Smith
Bought by
Harrison Fam Trust
Purchase Details
Closed on
Apr 21, 1989
Bought by
Holder Frm R and Holder Holder
Purchase Details
Closed on
Jan 21, 1983
Bought by
Frm Dale Horn
Create a Home Valuation Report for This Property
The Home Valuation Report is an in-depth analysis detailing your home's value as well as a comparison with similar homes in the area
Purchase History
| Date | Buyer | Sale Price | Title Company |
|---|---|---|---|
| Vanwoy | $130,000 | -- | |
| Webster | $121,000 | -- | |
| Underwood | $84,000 | -- | |
| Harrison Fam Trust | $75,000 | -- | |
| Holder Frm R | $55,000 | -- | |
| Frm Dale Horn | $61,000 | -- |
Source: Public Records
Tax History
| Year | Tax Paid | Tax Assessment Tax Assessment Total Assessment is a certain percentage of the fair market value that is determined by local assessors to be the total taxable value of land and additions on the property. | Land | Improvement |
|---|---|---|---|---|
| 2025 | $1,323 | $94,280 | $5,250 | $89,030 |
| 2024 | $1,423 | $69,650 | $4,500 | $65,150 |
| 2023 | $1,498 | $69,650 | $4,500 | $65,150 |
| 2022 | $1,548 | $69,650 | $4,500 | $65,150 |
| 2021 | $1,549 | $43,700 | $3,750 | $39,950 |
| 2020 | $1,549 | $43,700 | $3,750 | $39,950 |
| 2019 | $1,567 | $43,700 | $3,750 | $39,950 |
| 2018 | $1,592 | $43,700 | $3,750 | $39,950 |
| 2017 | $1,592 | $43,700 | $3,750 | $39,950 |
| 2016 | $1,499 | $36,600 | $3,000 | $33,600 |
| 2014 | -- | $36,600 | $3,000 | $33,600 |
Source: Public Records
Map
Nearby Homes
Your Personal Tour Guide
Ask me questions while you tour the home.