Estimated Value: $114,000 - $124,000
3
Beds
2
Baths
1,287
Sq Ft
$92/Sq Ft
Est. Value
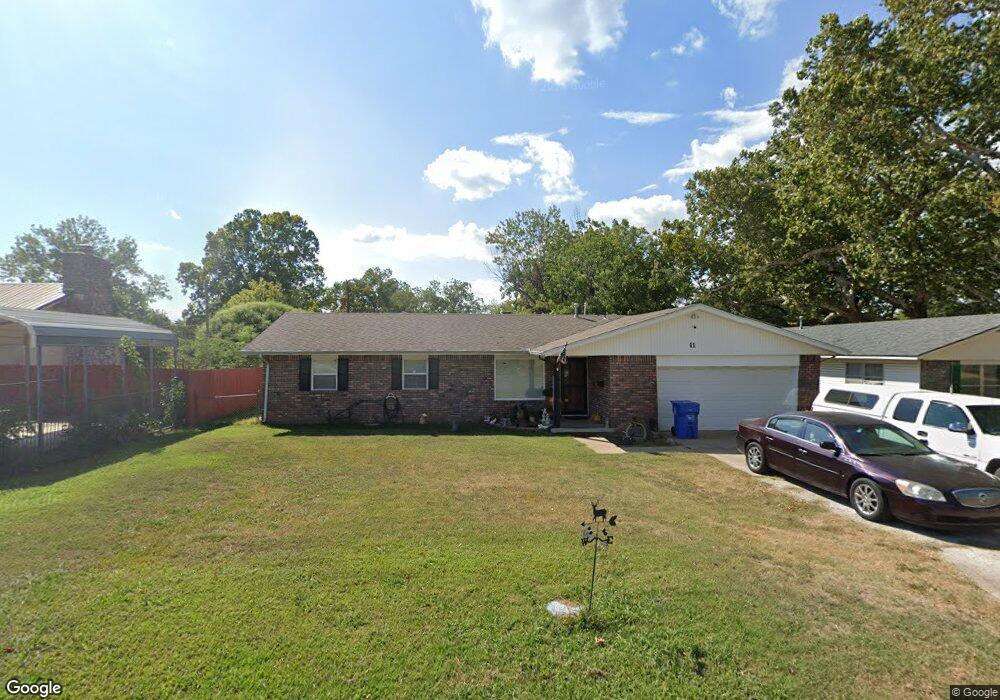
About This Home
This home is located at 11 F St NW, Miami, OK 74354 and is currently estimated at $118,189, approximately $91 per square foot. 11 F St NW is a home located in Ottawa County with nearby schools including Miami High School and Mt. Olive Lutheran School.
Ownership History
Date
Name
Owned For
Owner Type
Purchase Details
Closed on
Jan 18, 2023
Sold by
Pennymac Loan Services Llc
Bought by
Jones Michael T and Oliveros-Jones Debra
Current Estimated Value
Purchase Details
Closed on
Aug 8, 2018
Sold by
Watson Michael E and Watson Donna
Bought by
Greenfeather Kyle C and Greenfeather Kyia
Home Financials for this Owner
Home Financials are based on the most recent Mortgage that was taken out on this home.
Original Mortgage
$82,020
Interest Rate
4.5%
Mortgage Type
New Conventional
Purchase Details
Closed on
May 20, 2010
Sold by
Hallock Warren W
Bought by
Watson Michael E
Home Financials for this Owner
Home Financials are based on the most recent Mortgage that was taken out on this home.
Original Mortgage
$52,000
Interest Rate
5%
Mortgage Type
New Conventional
Purchase Details
Closed on
Sep 27, 1995
Bought by
Hallock Warren and Hallock Clara M
Create a Home Valuation Report for This Property
The Home Valuation Report is an in-depth analysis detailing your home's value as well as a comparison with similar homes in the area
Home Values in the Area
Average Home Value in this Area
Purchase History
| Date | Buyer | Sale Price | Title Company |
|---|---|---|---|
| Jones Michael T | $90,000 | -- | |
| Greenfeather Kyle C | $81,000 | Ottawa County Abstract & Tit | |
| Watson Michael E | $80,000 | None Available | |
| Hallock Warren | $60,500 | -- |
Source: Public Records
Mortgage History
| Date | Status | Borrower | Loan Amount |
|---|---|---|---|
| Previous Owner | Greenfeather Kyle C | $82,020 | |
| Previous Owner | Watson Michael E | $52,000 |
Source: Public Records
Tax History Compared to Growth
Tax History
| Year | Tax Paid | Tax Assessment Tax Assessment Total Assessment is a certain percentage of the fair market value that is determined by local assessors to be the total taxable value of land and additions on the property. | Land | Improvement |
|---|---|---|---|---|
| 2025 | $893 | $9,424 | $662 | $8,762 |
| 2024 | $893 | $10,260 | $662 | $9,598 |
| 2023 | $893 | $11,034 | $627 | $10,407 |
| 2022 | $971 | $10,509 | $627 | $9,882 |
| 2021 | $946 | $10,008 | $627 | $9,381 |
| 2020 | $908 | $9,532 | $627 | $8,905 |
| 2019 | $758 | $9,234 | $627 | $8,607 |
| 2018 | $769 | $9,300 | $627 | $8,673 |
| 2017 | $697 | $9,300 | $627 | $8,673 |
| 2016 | $652 | $9,120 | $627 | $8,493 |
| 2015 | $428 | $4,815 | $465 | $4,350 |
| 2014 | $665 | $9,120 | $627 | $8,493 |
Source: Public Records
Map
Nearby Homes