11 F St SE Ephrata, WA 98823
Estimated Value: $235,000 - $330,000
3
Beds
2
Baths
1,664
Sq Ft
$169/Sq Ft
Est. Value
About This Home
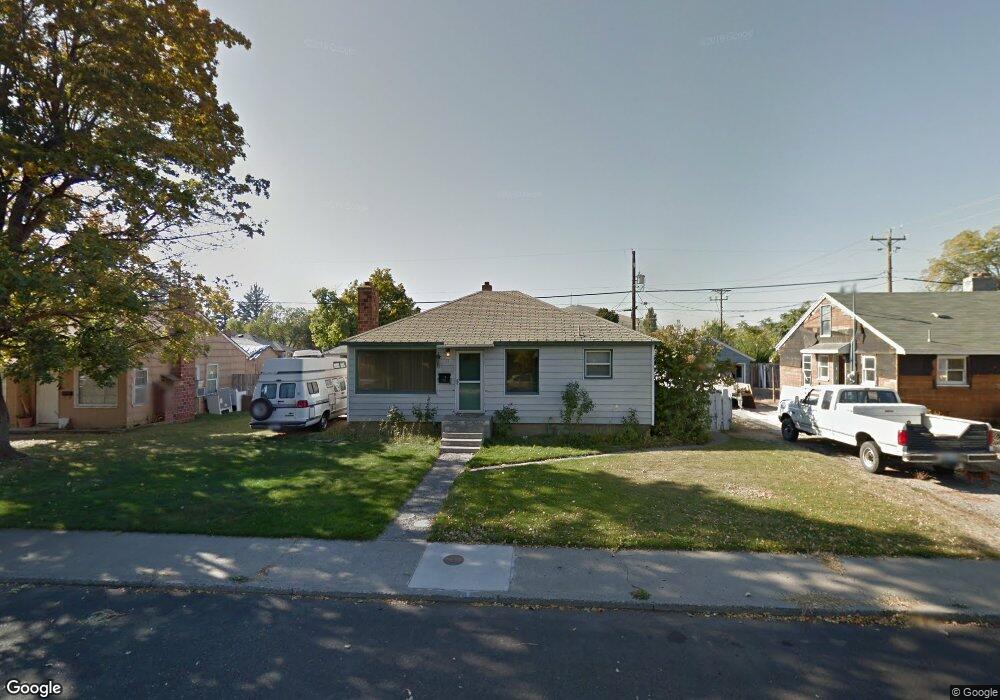
This home is located at 11 F St SE, Ephrata, WA 98823 and is currently estimated at $281,073, approximately $168 per square foot. 11 F St SE is a home located in Grant County with nearby schools including Ephrata High School, New Life Christian School, and St. Rose of Lima Catholic School.
Ownership History
Date
Name
Owned For
Owner Type
Purchase Details
Closed on
Oct 8, 2013
Sold by
Underwood Andrew
Bought by
Underwood Andrew J and Underwood Cassandra R
Current Estimated Value
Home Financials for this Owner
Home Financials are based on the most recent Mortgage that was taken out on this home.
Original Mortgage
$132,204
Outstanding Balance
$99,534
Interest Rate
4.55%
Mortgage Type
New Conventional
Estimated Equity
$181,539
Purchase Details
Closed on
Apr 22, 2008
Sold by
Spencer Jeff and Spencer Kelli
Bought by
Underwood Andrew
Home Financials for this Owner
Home Financials are based on the most recent Mortgage that was taken out on this home.
Original Mortgage
$136,734
Interest Rate
6.11%
Mortgage Type
Purchase Money Mortgage
Purchase Details
Closed on
Nov 23, 2007
Sold by
Krueger Andrew and Krueger Deborah R
Bought by
Spencer Jeff and Millet Lorin Edward
Create a Home Valuation Report for This Property
The Home Valuation Report is an in-depth analysis detailing your home's value as well as a comparison with similar homes in the area
Home Values in the Area
Average Home Value in this Area
Purchase History
| Date | Buyer | Sale Price | Title Company |
|---|---|---|---|
| Underwood Andrew J | -- | Frontier Title | |
| Underwood Andrew | $134,000 | Security Title Guaranty | |
| Spencer Jeff | $88,832 | Grant County Title |
Source: Public Records
Mortgage History
| Date | Status | Borrower | Loan Amount |
|---|---|---|---|
| Open | Underwood Andrew J | $132,204 | |
| Closed | Underwood Andrew | $136,734 |
Source: Public Records
Tax History Compared to Growth
Tax History
| Year | Tax Paid | Tax Assessment Tax Assessment Total Assessment is a certain percentage of the fair market value that is determined by local assessors to be the total taxable value of land and additions on the property. | Land | Improvement |
|---|---|---|---|---|
| 2024 | $1,803 | $159,462 | $18,500 | $140,962 |
| 2023 | $1,930 | $146,705 | $18,500 | $128,205 |
| 2022 | $1,831 | $146,705 | $18,500 | $128,205 |
| 2021 | $1,554 | $146,705 | $18,500 | $128,205 |
| 2020 | $1,643 | $118,580 | $18,500 | $100,080 |
| 2019 | $1,262 | $118,580 | $18,500 | $100,080 |
| 2018 | $1,473 | $101,495 | $20,000 | $81,495 |
| 2017 | $1,381 | $101,495 | $20,000 | $81,495 |
| 2016 | $1,384 | $94,325 | $20,000 | $74,325 |
| 2013 | -- | $96,535 | $20,000 | $76,535 |
Source: Public Records
Map
Nearby Homes