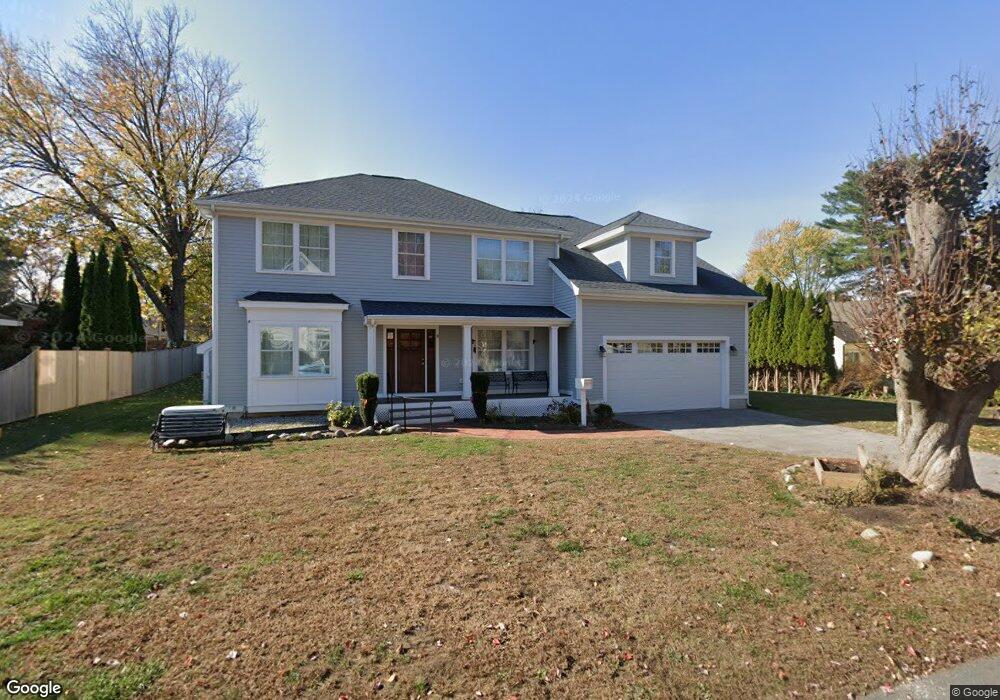
11 Fairview Ave Newbury, MA 01951
Estimated Value: $1,124,000 - $1,467,000
4
Beds
3
Baths
2,710
Sq Ft
$457/Sq Ft
Est. Value
About This Home
This home is located at 11 Fairview Ave, Newbury, MA 01951 and is currently estimated at $1,239,596, approximately $457 per square foot. 11 Fairview Ave is a home located in Essex County with nearby schools including Triton Regional High School, River Valley Charter School, and Immaculate Conception School.
Ownership History
Date
Name
Owned For
Owner Type
Purchase Details
Closed on
Feb 1, 2017
Sold by
11 Fairview Ave Rt
Bought by
Miceli Mary A
Current Estimated Value
Home Financials for this Owner
Home Financials are based on the most recent Mortgage that was taken out on this home.
Original Mortgage
$180,000
Outstanding Balance
$149,448
Interest Rate
4.3%
Mortgage Type
New Conventional
Estimated Equity
$1,090,148
Purchase Details
Closed on
May 1, 2015
Sold by
Ross Ft
Bought by
11 Fairview Ave Rt
Home Financials for this Owner
Home Financials are based on the most recent Mortgage that was taken out on this home.
Original Mortgage
$535,000
Interest Rate
3.76%
Mortgage Type
Purchase Money Mortgage
Purchase Details
Closed on
Oct 7, 2011
Sold by
Ross Richard A and Ross Helen M
Bought by
Ross 2011 Ft
Create a Home Valuation Report for This Property
The Home Valuation Report is an in-depth analysis detailing your home's value as well as a comparison with similar homes in the area
Home Values in the Area
Average Home Value in this Area
Purchase History
| Date | Buyer | Sale Price | Title Company |
|---|---|---|---|
| Miceli Mary A | $690,000 | -- | |
| Miceli Mary A | $690,000 | -- | |
| 11 Fairview Ave Rt | $325,000 | -- | |
| 11 Fairview Ave Rt | $325,000 | -- | |
| Ross 2011 Ft | -- | -- | |
| Ross 2011 Ft | -- | -- |
Source: Public Records
Mortgage History
| Date | Status | Borrower | Loan Amount |
|---|---|---|---|
| Open | Miceli Mary A | $180,000 | |
| Closed | Miceli Mary A | $180,000 | |
| Previous Owner | 11 Fairview Ave Rt | $535,000 |
Source: Public Records
Tax History Compared to Growth
Tax History
| Year | Tax Paid | Tax Assessment Tax Assessment Total Assessment is a certain percentage of the fair market value that is determined by local assessors to be the total taxable value of land and additions on the property. | Land | Improvement |
|---|---|---|---|---|
| 2025 | $6,774 | $909,200 | $264,700 | $644,500 |
| 2024 | $6,696 | $871,900 | $264,700 | $607,200 |
| 2023 | $6,973 | $804,300 | $247,000 | $557,300 |
| 2022 | $6,851 | $704,100 | $213,300 | $490,800 |
| 2021 | $6,789 | $636,900 | $177,700 | $459,200 |
| 2020 | $6,813 | $619,900 | $177,700 | $442,200 |
| 2019 | $6,701 | $619,900 | $177,700 | $442,200 |
| 2018 | $5,314 | $487,500 | $172,400 | $315,100 |
| 2017 | $5,006 | $471,800 | $172,400 | $299,400 |
| 2016 | $3,764 | $330,200 | $159,900 | $170,300 |
| 2015 | $3,386 | $293,900 | $124,400 | $169,500 |
| 2014 | $3,158 | $279,000 | $115,500 | $163,500 |
Source: Public Records
Map
Nearby Homes
- 1 Lancaster Rd
- 11 High Rd
- 3 Riverview Dr
- 4 Goodwin Ave
- 1 Littles Ln
- 65 Bromfield St
- 4 Hanover St
- 7 Parsons St
- 111 Prospect St Unit A
- 113 Prospect St Unit B
- 12 Parsons St Unit 2
- 164 Water St
- 164 Water St Unit A
- 166 Water St Unit B
- 58 Lime St Unit 5
- 78 High St
- 42 Federal St Unit B
- 11 Orange St Unit 2
- 9 Orange St Unit 1
- 9 Orange St