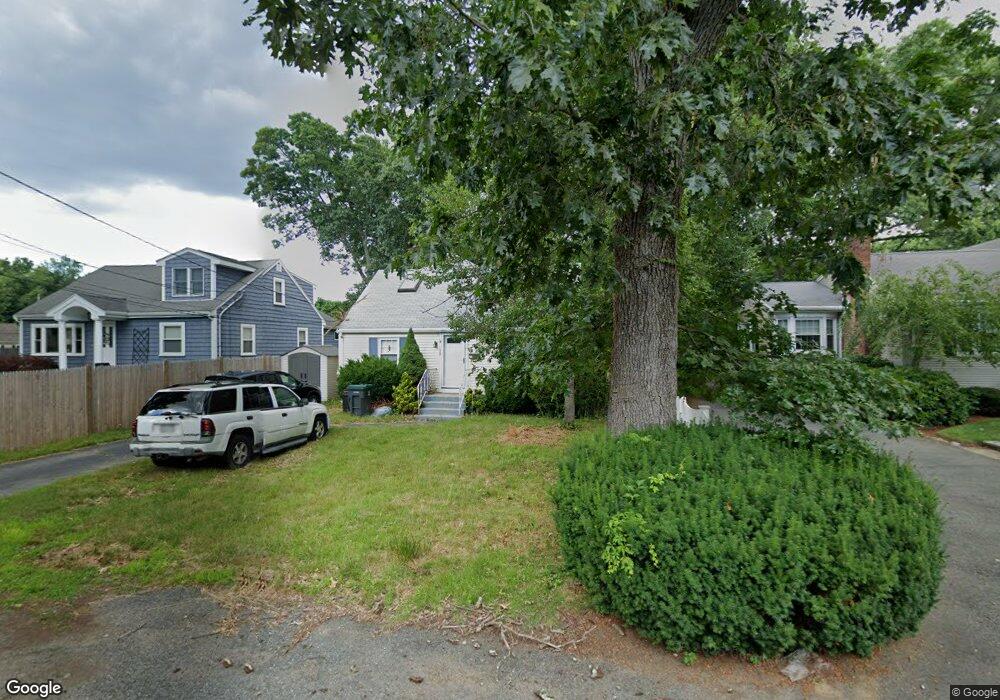
11 Fern St Natick, MA 01760
Estimated Value: $627,000 - $1,059,000
3
Beds
2
Baths
1,836
Sq Ft
$426/Sq Ft
Est. Value
About This Home
This home is located at 11 Fern St, Natick, MA 01760 and is currently estimated at $782,773, approximately $426 per square foot. 11 Fern St is a home located in Middlesex County with nearby schools including Natick High School, J F Kennedy Middle School, and Johnson Elementary School.
Ownership History
Date
Name
Owned For
Owner Type
Purchase Details
Closed on
Jul 29, 2025
Sold by
Canning Deborah L
Bought by
11 Fern Street Rt and Mabardy
Current Estimated Value
Purchase Details
Closed on
Jul 16, 1992
Sold by
Canning Margaret M
Bought by
Canning Robert T and Canning Deborah
Create a Home Valuation Report for This Property
The Home Valuation Report is an in-depth analysis detailing your home's value as well as a comparison with similar homes in the area
Home Values in the Area
Average Home Value in this Area
Purchase History
| Date | Buyer | Sale Price | Title Company |
|---|---|---|---|
| 11 Fern Street Rt | $625,000 | -- | |
| 11 Fern Street Rt | $625,000 | -- | |
| Canning Robert T | $100,000 | -- |
Source: Public Records
Mortgage History
| Date | Status | Borrower | Loan Amount |
|---|---|---|---|
| Previous Owner | Canning Robert T | $97,615 | |
| Previous Owner | Canning Robert T | $132,000 | |
| Previous Owner | Canning Robert T | $17,900 | |
| Previous Owner | Canning Robert T | $156,200 |
Source: Public Records
Tax History Compared to Growth
Tax History
| Year | Tax Paid | Tax Assessment Tax Assessment Total Assessment is a certain percentage of the fair market value that is determined by local assessors to be the total taxable value of land and additions on the property. | Land | Improvement |
|---|---|---|---|---|
| 2025 | $7,761 | $648,900 | $398,900 | $250,000 |
| 2024 | $7,465 | $608,900 | $375,400 | $233,500 |
| 2023 | $7,480 | $591,800 | $361,300 | $230,500 |
| 2022 | $7,214 | $540,800 | $328,500 | $212,300 |
| 2021 | $6,900 | $507,000 | $309,700 | $197,300 |
| 2020 | $13,024 | $492,900 | $295,600 | $197,300 |
| 2019 | $12,214 | $492,900 | $295,600 | $197,300 |
| 2018 | $5,734 | $439,400 | $281,600 | $157,800 |
| 2017 | $17 | $382,300 | $239,300 | $143,000 |
| 2016 | $4,827 | $355,700 | $213,900 | $141,800 |
| 2015 | $4,754 | $344,000 | $213,900 | $130,100 |
Source: Public Records
Map
Nearby Homes
- 1 Fern St
- 91 Speen St
- 4 Sylvia Ave
- 16 West St
- 46 Silver Hill Ln Unit 1
- 40 Silver Hill Ln Unit 4
- 26 Walden Dr Unit 4
- 9 Silver Hill Ln Unit 19
- 25 Forest Ave
- 216-218 S Main St
- 32 Silver Hill Ln Unit 1
- 12 Walden Dr Unit 19
- 47 High St
- 2 Lodge Rd
- 6 Ambler Ct
- 105 N Main St
- 58 W Central St
- 8 Floral Avenue Extension
- 10 Kelsey Rd
- 57 Village Brook Ln Unit 5