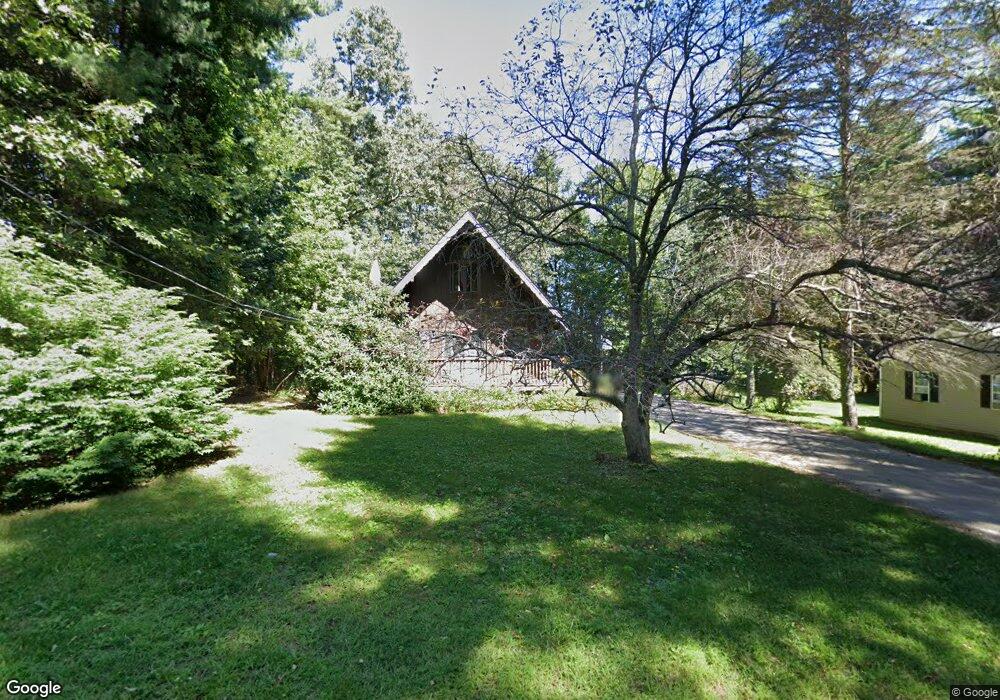
11 Ferncroft Rd Leicester, MA 01524
Estimated Value: $361,000 - $412,000
3
Beds
1
Bath
1,200
Sq Ft
$316/Sq Ft
Est. Value
About This Home
This home is located at 11 Ferncroft Rd, Leicester, MA 01524 and is currently estimated at $378,717, approximately $315 per square foot. 11 Ferncroft Rd is a home located in Worcester County with nearby schools including Leicester Integrated Preschool, Leicester Memorial Elementary School, and Leicester Middle School.
Ownership History
Date
Name
Owned For
Owner Type
Purchase Details
Closed on
Jul 27, 2007
Sold by
Ashworth Carolyn M and Ashworth Edward T
Bought by
Cochowski Georgia and Cochowski Richard J
Current Estimated Value
Home Financials for this Owner
Home Financials are based on the most recent Mortgage that was taken out on this home.
Original Mortgage
$229,900
Outstanding Balance
$145,111
Interest Rate
6.78%
Mortgage Type
Purchase Money Mortgage
Estimated Equity
$233,606
Create a Home Valuation Report for This Property
The Home Valuation Report is an in-depth analysis detailing your home's value as well as a comparison with similar homes in the area
Home Values in the Area
Average Home Value in this Area
Purchase History
| Date | Buyer | Sale Price | Title Company |
|---|---|---|---|
| Cochowski Georgia | $229,900 | -- | |
| Cochowski Georgia | $229,900 | -- |
Source: Public Records
Mortgage History
| Date | Status | Borrower | Loan Amount |
|---|---|---|---|
| Open | Cochowski Georgia | $229,900 | |
| Closed | Cochowski Georgia | $229,900 | |
| Previous Owner | Cochowski Georgia | $15,238 | |
| Previous Owner | Cochowski Georgia | $85,000 |
Source: Public Records
Tax History Compared to Growth
Tax History
| Year | Tax Paid | Tax Assessment Tax Assessment Total Assessment is a certain percentage of the fair market value that is determined by local assessors to be the total taxable value of land and additions on the property. | Land | Improvement |
|---|---|---|---|---|
| 2025 | $34 | $290,500 | $73,000 | $217,500 |
| 2024 | $3,232 | $257,500 | $63,100 | $194,400 |
| 2023 | $3,077 | $239,300 | $63,100 | $176,200 |
| 2022 | $2,987 | $213,500 | $60,300 | $153,200 |
| 2021 | $3,144 | $207,800 | $60,300 | $147,500 |
| 2020 | $2,705 | $181,400 | $54,700 | $126,700 |
| 2019 | $2,533 | $168,000 | $49,100 | $118,900 |
| 2018 | $2,459 | $152,800 | $49,100 | $103,700 |
| 2017 | $2,365 | $152,800 | $49,100 | $103,700 |
| 2016 | $2,290 | $153,700 | $61,100 | $92,600 |
| 2015 | $2,235 | $153,700 | $61,100 | $92,600 |
Source: Public Records
Map
Nearby Homes
- 13 Ferncroft Rd
- 10 Fairview Dr
- 10 Ferncroft Rd
- 12 Ferncroft Rd
- 5 Ferncroft Rd
- 14 Ferncroft Rd
- 8 Ferncroft Rd
- 12 Fairview Dr
- 17 Ferncroft Rd
- 6 Fairview Dr
- 1 Meadow Ln
- 18 Fairview Dr
- 13 Fairview Dr
- 11 Fairview Dr
- 9 Fairview Dr
- 24 Fairview Dr
- 15 Fairview Dr
- 18 Ferncroft Rd
- 17 Fairview Dr
- 19 Fairview Dr