Estimated Value: $306,302 - $364,000
--
Bed
--
Bath
2,752
Sq Ft
$123/Sq Ft
Est. Value
About This Home
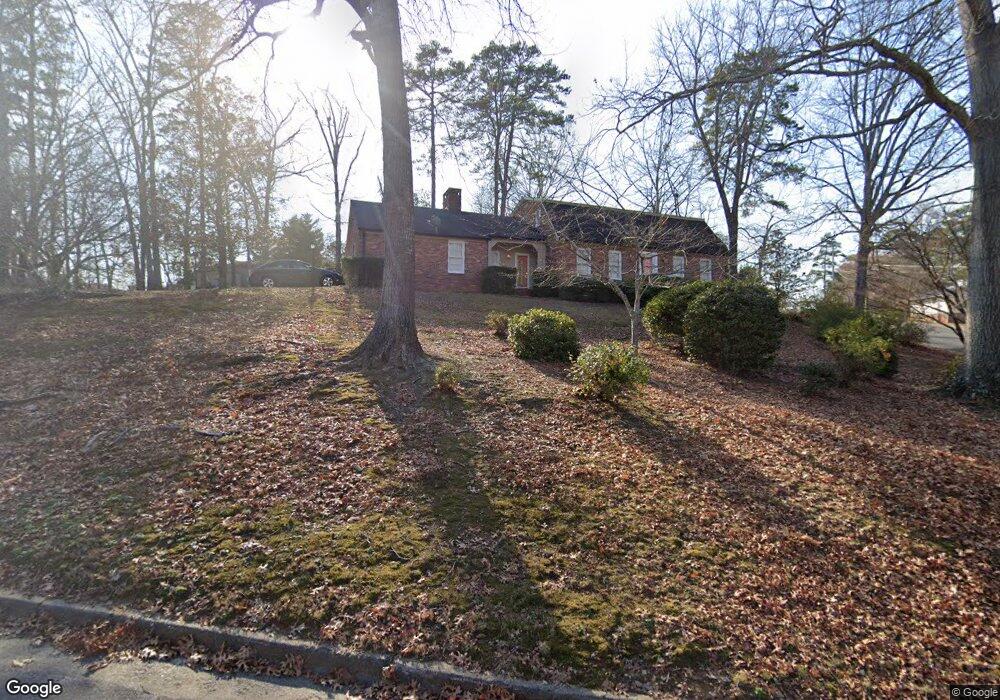
This home is located at 11 Fernwood Dr SW, Rome, GA 30165 and is currently estimated at $337,576, approximately $122 per square foot. 11 Fernwood Dr SW is a home located in Floyd County with nearby schools including Rome High School.
Ownership History
Date
Name
Owned For
Owner Type
Purchase Details
Closed on
Jun 5, 2008
Sold by
Not Provided
Bought by
Brown Brown Marcus L Marcus L and Brown Tamica N
Current Estimated Value
Home Financials for this Owner
Home Financials are based on the most recent Mortgage that was taken out on this home.
Original Mortgage
$162,943
Outstanding Balance
$104,506
Interest Rate
6.04%
Mortgage Type
FHA
Estimated Equity
$233,070
Purchase Details
Closed on
Aug 6, 2001
Sold by
Leonard Al and Pam Leonard
Bought by
Bennett Gary D and Bennett Deborah P
Purchase Details
Closed on
Oct 31, 1990
Sold by
Burdette James M and Sara Alice
Bought by
Leonard Al and Pam Leonard
Purchase Details
Closed on
Dec 27, 1971
Sold by
Davis Clyde R Bldrs
Bought by
Burdette James M and Sara Alice
Purchase Details
Closed on
Mar 26, 1970
Bought by
Davis Clyde R Bldrs
Create a Home Valuation Report for This Property
The Home Valuation Report is an in-depth analysis detailing your home's value as well as a comparison with similar homes in the area
Home Values in the Area
Average Home Value in this Area
Purchase History
| Date | Buyer | Sale Price | Title Company |
|---|---|---|---|
| Brown Brown Marcus L Marcus L | $165,500 | -- | |
| Brown Marcus L | $165,500 | -- | |
| Bennett Gary D | $142,500 | -- | |
| Leonard Al | $119,000 | -- | |
| Burdette James M | $38,000 | -- | |
| Davis Clyde R Bldrs | -- | -- |
Source: Public Records
Mortgage History
| Date | Status | Borrower | Loan Amount |
|---|---|---|---|
| Open | Brown Marcus L | $162,943 | |
| Closed | Brown Brown Marcus L Marcus L | $162,943 |
Source: Public Records
Tax History Compared to Growth
Tax History
| Year | Tax Paid | Tax Assessment Tax Assessment Total Assessment is a certain percentage of the fair market value that is determined by local assessors to be the total taxable value of land and additions on the property. | Land | Improvement |
|---|---|---|---|---|
| 2024 | $3,284 | $116,656 | $19,530 | $97,126 |
| 2023 | $3,256 | $110,447 | $17,640 | $92,807 |
| 2022 | $2,724 | $80,229 | $14,490 | $65,739 |
| 2021 | $2,634 | $73,319 | $14,490 | $58,829 |
| 2020 | $2,465 | $67,201 | $11,025 | $56,176 |
| 2019 | $2,336 | $64,379 | $11,025 | $53,354 |
| 2018 | $2,226 | $61,413 | $11,025 | $50,388 |
| 2017 | $2,124 | $58,645 | $11,025 | $47,620 |
| 2016 | $2,101 | $57,880 | $11,000 | $46,880 |
| 2015 | $2,099 | $58,680 | $11,000 | $47,680 |
| 2014 | $2,099 | $61,114 | $11,000 | $50,114 |
Source: Public Records
Map
Nearby Homes
- 121 Kenwood Dr SW
- 203 Hycliff Rd SW
- 2 Thornwood Dr SW
- 106 Kenwood Dr SW
- 8 Bush Arbor Place SW
- 10 Bush Arbor Place SW
- 120 Thornwood Dr SW
- 125 Thornwood Dr SW
- 23 Bush Arbor Place SW
- 130 Thornwood Dr SW
- 15 Ladonna Place SW
- The Foxcroft Plan at North Haven
- The Benson II Plan at North Haven
- The Coleman Plan at North Haven
- The Bradley Plan at North Haven
- The McGinnis Plan at North Haven
- The Pearson Plan at North Haven
- The Caldwell Plan at North Haven
- The Grayson Plan at North Haven
- 9 Ladonna Place SW
- 9 Thornwood Dr SW
- 103 Elmwood Dr SW
- 9 Fernwood Dr SW
- 10 Fernwood Dr SW
- 14 Thornwood Dr SW
- 105 Elmwood Dr SW
- 16 Thornwood Dr SW
- 12 Thornwood Dr SW
- 8 Fernwood Dr SW
- 0 Fernwood Dr Unit 7232596
- 0 Fernwood Dr
- 3 Elmwood Dr SW
- 7 Fernwood Dr SW
- 10 Thornwood Dr SW
- 102 Elmwood Dr SW
- 102 Elmwood Dr SW
- 118 Kenwood Dr SW
- 118 Kenwood Dr SW
- 107 Elmwood Dr SW
- 101 Thornwood Dr SW