11 Fielding St Wakefield, MA 01880
West Side NeighborhoodEstimated Value: $739,000 - $869,000
About This Home
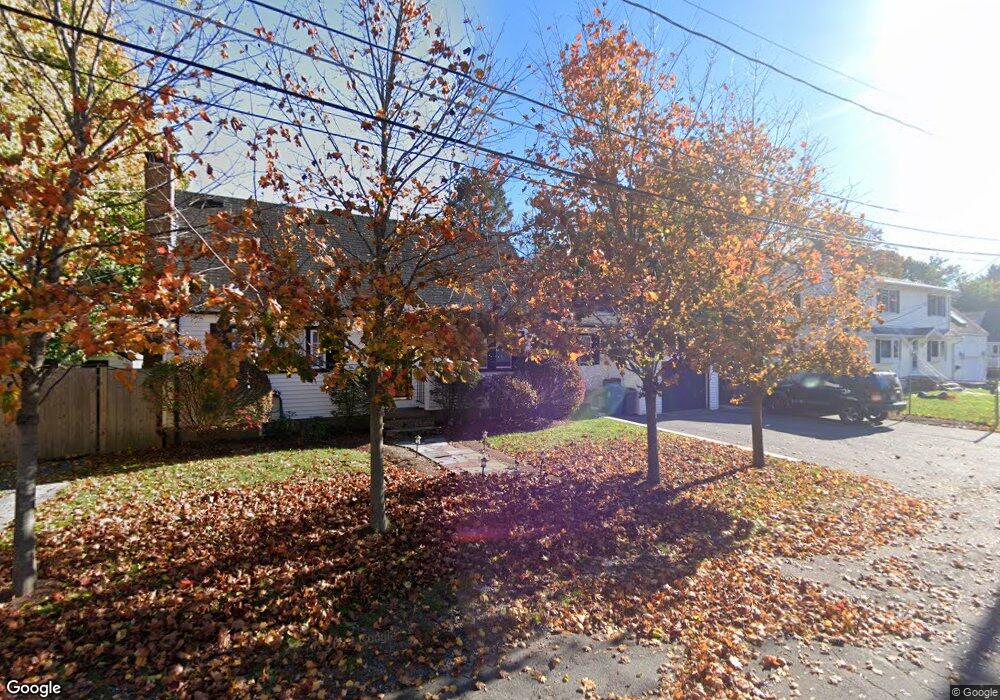
This home is located at 11 Fielding St, Wakefield, MA 01880 and is currently estimated at $830,034, approximately $489 per square foot. 11 Fielding St is a home located in Middlesex County with nearby schools including Wakefield Memorial High School and St Joseph School.
Ownership History
We collect this data history from publicly available records. To have your information removed, we recommend requesting removal directly through your county’s website.
Purchase Details
Home Financials for this Owner
Home Financials are based on the most recent Mortgage that was taken out on this home.Purchase Details
Home Financials for this Owner
Home Financials are based on the most recent Mortgage that was taken out on this home.Home Values in the Area
Average Home Value in this Area
Purchase History
We collect this data history from publicly available records. To have your information removed, we recommend requesting removal directly through your county’s website.
| Date | Buyer | Sale Price | Title Company |
|---|---|---|---|
| $234,000 | -- | ||
| $190,000 | -- |
Mortgage History
We collect this data history from publicly available records. To have your information removed, we recommend requesting removal directly through your county’s website.
| Date | Status | Borrower | Loan Amount |
|---|---|---|---|
| Open | $100,000 | ||
| Previous Owner | $112,000 | ||
| Previous Owner | $115,000 | ||
| Previous Owner | $152,000 |
Tax History
We collect this data history from publicly available records. To have your information removed, we recommend requesting removal directly through your county’s website.
| Year | Tax Paid | Tax Assessment Tax Assessment Total Assessment is a certain percentage of the fair market value that is determined by local assessors to be the total taxable value of land and additions on the property. | Land | Improvement |
|---|---|---|---|---|
| 2025 | $8,709 | $767,300 | $406,400 | $360,900 |
| 2024 | $8,038 | $714,500 | $378,000 | $336,500 |
| 2023 | $7,831 | $667,600 | $352,800 | $314,800 |
| 2022 | $7,358 | $597,200 | $315,000 | $282,200 |
| 2021 | $7,110 | $558,500 | $288,000 | $270,500 |
| 2020 | $6,686 | $523,600 | $270,000 | $253,600 |
| 2019 | $6,270 | $488,700 | $252,000 | $236,700 |
| 2018 | $6,046 | $466,900 | $240,800 | $226,100 |
| 2017 | $5,686 | $436,400 | $225,000 | $211,400 |
| 2016 | $5,685 | $421,400 | $222,100 | $199,300 |
| 2015 | $5,318 | $394,500 | $207,600 | $186,900 |
| 2014 | $4,922 | $385,100 | $202,500 | $182,600 |
Map
- 22 Eustis Ave
- 48 N Emerson St Unit 1
- 116 Parker Rd
- 44 Church St
- 13 Parker Rd
- 22 Sweetser St
- 9 White Ave
- 3 Summit Dr Unit 17
- 20 Lawrence St Unit 2
- 284 Main St
- 7 Beebe Ln
- 317 Main St Unit 7
- 3 Walnut St
- 1 Summit Dr Unit 24
- 12 Lakeview Ave
- 22 Park St Unit 22A
- 22 Park St Unit B
- 22 Park St Unit A
- 24 Park St
- 713 Gazebo Cir Unit 713
Ask me questions while you tour the home.