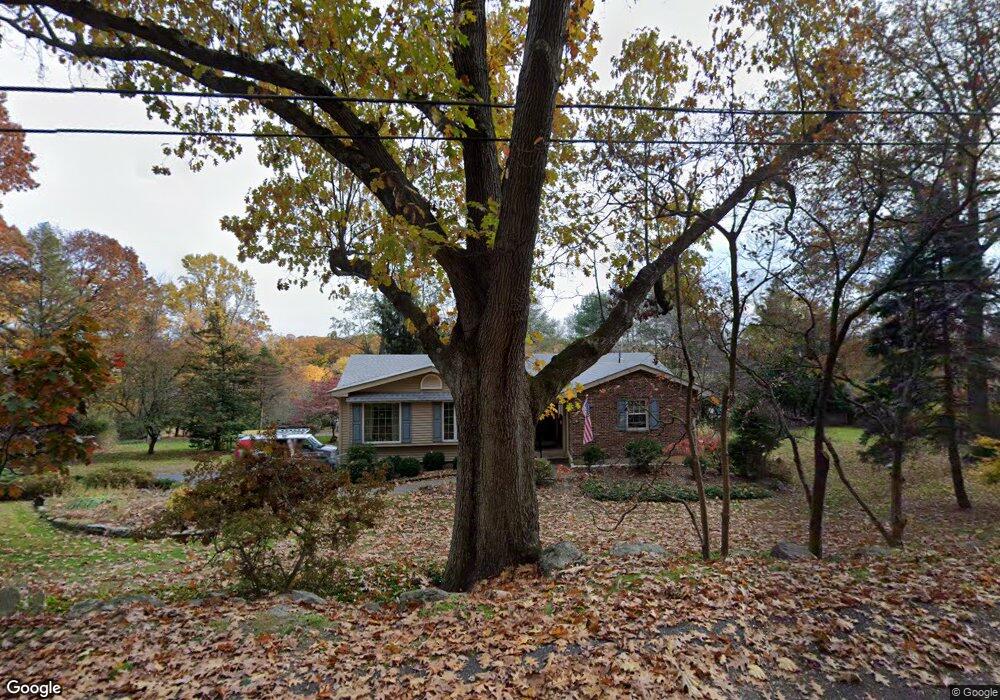
11 Fine Rd High Bridge, NJ 08829
Estimated Value: $485,917 - $632,000
--
Bed
--
Bath
1,413
Sq Ft
$387/Sq Ft
Est. Value
About This Home
This home is located at 11 Fine Rd, High Bridge, NJ 08829 and is currently estimated at $546,229, approximately $386 per square foot. 11 Fine Rd is a home located in Hunterdon County with nearby schools including High Bridge Elementary School, High Bridge Middle School, and Voorhees High School.
Ownership History
Date
Name
Owned For
Owner Type
Purchase Details
Closed on
Jun 28, 2007
Sold by
Brighton Lauren J
Bought by
Rollins John A and Paxton Janice R
Current Estimated Value
Home Financials for this Owner
Home Financials are based on the most recent Mortgage that was taken out on this home.
Original Mortgage
$309,000
Outstanding Balance
$190,497
Interest Rate
6.24%
Mortgage Type
Purchase Money Mortgage
Estimated Equity
$355,732
Create a Home Valuation Report for This Property
The Home Valuation Report is an in-depth analysis detailing your home's value as well as a comparison with similar homes in the area
Home Values in the Area
Average Home Value in this Area
Purchase History
| Date | Buyer | Sale Price | Title Company |
|---|---|---|---|
| Rollins John A | $399,000 | Fidelity Natl Title Ins Co |
Source: Public Records
Mortgage History
| Date | Status | Borrower | Loan Amount |
|---|---|---|---|
| Open | Rollins John A | $309,000 |
Source: Public Records
Tax History Compared to Growth
Tax History
| Year | Tax Paid | Tax Assessment Tax Assessment Total Assessment is a certain percentage of the fair market value that is determined by local assessors to be the total taxable value of land and additions on the property. | Land | Improvement |
|---|---|---|---|---|
| 2025 | $13,252 | $357,900 | $168,500 | $189,400 |
| 2024 | $13,252 | $406,000 | $127,700 | $278,300 |
| 2023 | $12,226 | $309,200 | $103,900 | $205,300 |
| 2022 | $11,374 | $267,300 | $98,900 | $168,400 |
| 2021 | $11,133 | $267,600 | $98,900 | $168,700 |
| 2020 | $11,009 | $268,500 | $98,900 | $169,600 |
| 2019 | $11,133 | $269,500 | $98,900 | $170,600 |
| 2018 | $10,704 | $270,100 | $98,500 | $171,600 |
| 2017 | $10,028 | $260,200 | $98,500 | $161,700 |
| 2016 | $9,911 | $260,200 | $98,500 | $161,700 |
| 2015 | $9,643 | $260,200 | $98,500 | $161,700 |
| 2014 | $10,458 | $305,000 | $165,800 | $139,200 |
Source: Public Records
Map
Nearby Homes