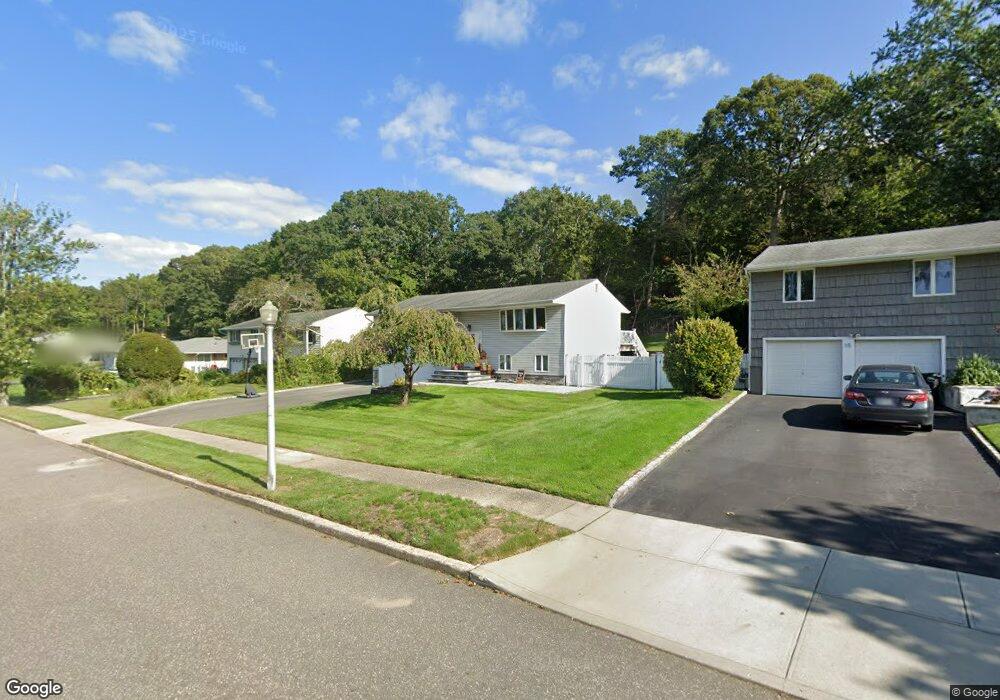
11 Fisher Rd ComMacK, NY 11725
Estimated Value: $785,610 - $878,000
4
Beds
2
Baths
1,230
Sq Ft
$673/Sq Ft
Est. Value
About This Home
This home is located at 11 Fisher Rd, ComMacK, NY 11725 and is currently estimated at $828,403, approximately $673 per square foot. 11 Fisher Rd is a home located in Suffolk County with nearby schools including Sullivan Village Elementary School, Pioneer Park Elementary School, and Commack Middle School.
Ownership History
Date
Name
Owned For
Owner Type
Purchase Details
Closed on
Oct 30, 2020
Sold by
Chiang Sean
Bought by
Chiang Sean and Chiang Lin
Current Estimated Value
Home Financials for this Owner
Home Financials are based on the most recent Mortgage that was taken out on this home.
Original Mortgage
$348,000
Outstanding Balance
$309,671
Interest Rate
2.8%
Mortgage Type
New Conventional
Estimated Equity
$518,732
Purchase Details
Closed on
Nov 12, 2014
Sold by
Bordner Willam M and Bordner Melanie
Bought by
Chiang Sean
Home Financials for this Owner
Home Financials are based on the most recent Mortgage that was taken out on this home.
Original Mortgage
$359,200
Interest Rate
3.37%
Mortgage Type
New Conventional
Create a Home Valuation Report for This Property
The Home Valuation Report is an in-depth analysis detailing your home's value as well as a comparison with similar homes in the area
Home Values in the Area
Average Home Value in this Area
Purchase History
| Date | Buyer | Sale Price | Title Company |
|---|---|---|---|
| Chiang Sean | -- | None Available | |
| Chiang Sean | $449,000 | None Available |
Source: Public Records
Mortgage History
| Date | Status | Borrower | Loan Amount |
|---|---|---|---|
| Open | Chiang Sean | $348,000 | |
| Previous Owner | Chiang Sean | $359,200 |
Source: Public Records
Tax History Compared to Growth
Tax History
| Year | Tax Paid | Tax Assessment Tax Assessment Total Assessment is a certain percentage of the fair market value that is determined by local assessors to be the total taxable value of land and additions on the property. | Land | Improvement |
|---|---|---|---|---|
| 2024 | $14,044 | $5,475 | $300 | $5,175 |
| 2023 | $14,044 | $5,475 | $300 | $5,175 |
| 2022 | $13,288 | $5,475 | $300 | $5,175 |
| 2021 | $13,288 | $5,475 | $300 | $5,175 |
| 2020 | $13,349 | $5,475 | $300 | $5,175 |
| 2019 | $13,349 | $5,475 | $300 | $5,175 |
| 2018 | -- | $5,475 | $300 | $5,175 |
| 2017 | $12,273 | $5,475 | $300 | $5,175 |
| 2016 | $12,154 | $5,475 | $300 | $5,175 |
| 2015 | -- | $5,475 | $300 | $5,175 |
| 2014 | -- | $5,475 | $300 | $5,175 |
Source: Public Records
Map
Nearby Homes