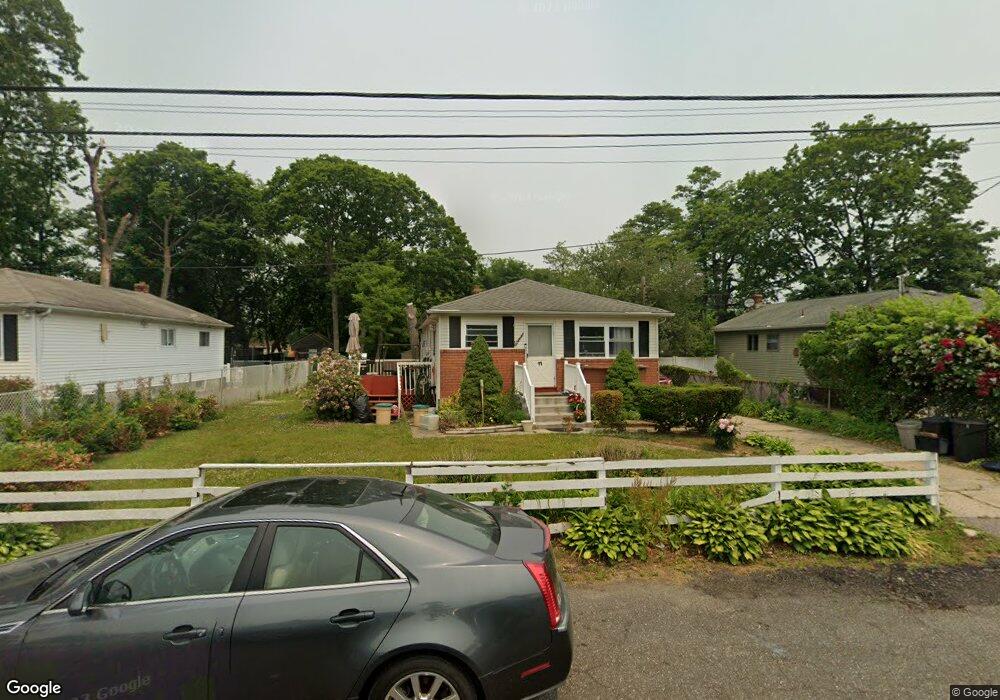
11 Fletcher Place Brentwood, NY 11717
Estimated Value: $520,336 - $739,000
--
Bed
--
Bath
--
Sq Ft
0.26
Acres
About This Home
This home is located at 11 Fletcher Place, Brentwood, NY 11717 and is currently estimated at $593,334. 11 Fletcher Place is a home located in Suffolk County with nearby schools including MDQ Academy.
Ownership History
Date
Name
Owned For
Owner Type
Purchase Details
Closed on
Oct 25, 2002
Sold by
Salomon David and Salomon Angela
Bought by
Salomon David
Current Estimated Value
Home Financials for this Owner
Home Financials are based on the most recent Mortgage that was taken out on this home.
Original Mortgage
$170,000
Outstanding Balance
$71,205
Interest Rate
6.02%
Mortgage Type
Purchase Money Mortgage
Estimated Equity
$522,129
Purchase Details
Closed on
Sep 28, 2000
Sold by
Valentin Ramon
Bought by
Salomon David and Salomon Angela
Home Financials for this Owner
Home Financials are based on the most recent Mortgage that was taken out on this home.
Original Mortgage
$130,300
Interest Rate
7.89%
Mortgage Type
FHA
Create a Home Valuation Report for This Property
The Home Valuation Report is an in-depth analysis detailing your home's value as well as a comparison with similar homes in the area
Home Values in the Area
Average Home Value in this Area
Purchase History
| Date | Buyer | Sale Price | Title Company |
|---|---|---|---|
| Salomon David | -- | -- | |
| Salomon David | $131,500 | Fidelity National Title Ins |
Source: Public Records
Mortgage History
| Date | Status | Borrower | Loan Amount |
|---|---|---|---|
| Open | Salomon David | $170,000 | |
| Closed | Salomon David | $130,300 |
Source: Public Records
Tax History Compared to Growth
Tax History
| Year | Tax Paid | Tax Assessment Tax Assessment Total Assessment is a certain percentage of the fair market value that is determined by local assessors to be the total taxable value of land and additions on the property. | Land | Improvement |
|---|---|---|---|---|
| 2024 | $7,176 | $32,800 | $8,700 | $24,100 |
| 2023 | $7,176 | $31,300 | $8,700 | $22,600 |
| 2022 | $6,089 | $31,300 | $8,700 | $22,600 |
| 2021 | $6,089 | $31,300 | $8,700 | $22,600 |
| 2020 | $6,361 | $31,300 | $8,700 | $22,600 |
| 2019 | $6,089 | $0 | $0 | $0 |
| 2018 | -- | $31,300 | $8,700 | $22,600 |
| 2017 | $6,167 | $31,300 | $8,700 | $22,600 |
| 2016 | $6,100 | $31,300 | $8,700 | $22,600 |
| 2015 | -- | $31,300 | $8,700 | $22,600 |
| 2014 | -- | $31,300 | $8,700 | $22,600 |
Source: Public Records
Map
Nearby Homes