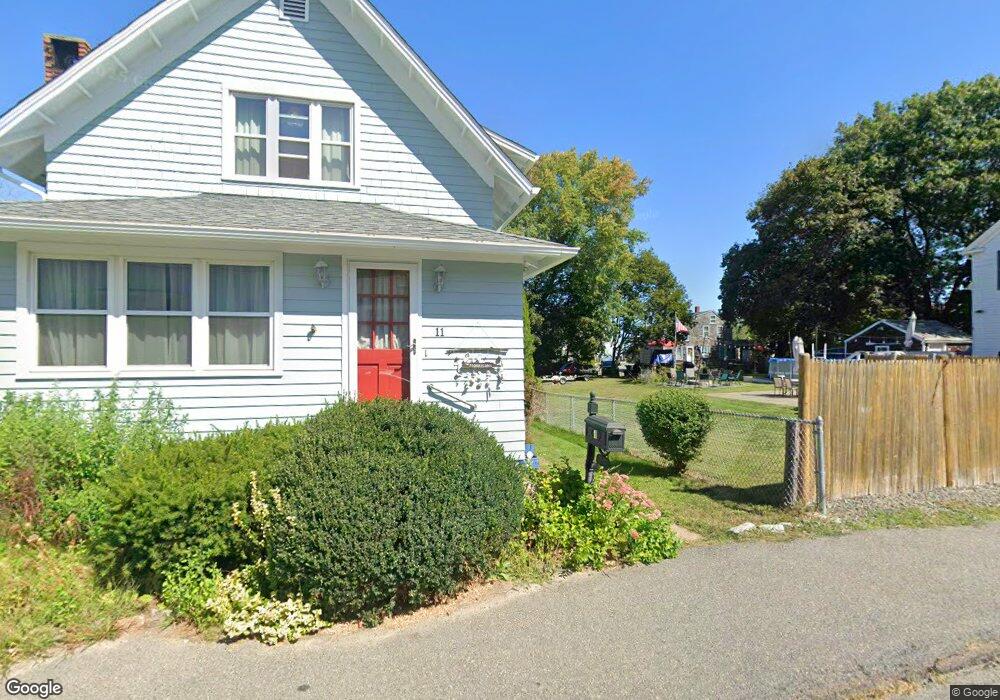
11 Forest St Rockport, MA 01966
Estimated Value: $638,000 - $670,182
3
Beds
2
Baths
1,320
Sq Ft
$496/Sq Ft
Est. Value
About This Home
This home is located at 11 Forest St, Rockport, MA 01966 and is currently estimated at $655,046, approximately $496 per square foot. 11 Forest St is a home located in Essex County with nearby schools including Rockport Elementary School, Rockport Middle School, and Rockport High School.
Ownership History
Date
Name
Owned For
Owner Type
Purchase Details
Closed on
Dec 16, 2016
Sold by
Morrison James M and Morrison Judith P
Bought by
Judith P Morrison Ret
Current Estimated Value
Purchase Details
Closed on
Apr 8, 2010
Sold by
Wells Fargo Bk
Bought by
Morrison Judy and Morrison James
Purchase Details
Closed on
Aug 7, 2009
Sold by
Fox Nathaniel S and Wells Fargo Bk
Bought by
Wells Fargo Bk
Purchase Details
Closed on
May 19, 2000
Sold by
Harling Daniel A and Harling Amanda
Bought by
Fox Nathanil S and Fox Kristina W
Purchase Details
Closed on
Sep 6, 1996
Sold by
Oconnor Kevin P and Oconnor Laurie
Bought by
Harling Daniel and Harling Amanda
Purchase Details
Closed on
Dec 3, 1990
Sold by
George Earl William
Bought by
Oconnor Kevin P
Create a Home Valuation Report for This Property
The Home Valuation Report is an in-depth analysis detailing your home's value as well as a comparison with similar homes in the area
Home Values in the Area
Average Home Value in this Area
Purchase History
| Date | Buyer | Sale Price | Title Company |
|---|---|---|---|
| Judith P Morrison Ret | -- | -- | |
| Judith P Morrison Ret | -- | -- | |
| Morrison Judy | $247,000 | -- | |
| Morrison Judy | $247,000 | -- | |
| Wells Fargo Bk | $305,000 | -- | |
| Wells Fargo Bk | $305,000 | -- | |
| Fox Nathanil S | $215,000 | -- | |
| Fox Nathanil S | $215,000 | -- | |
| Harling Daniel | $155,000 | -- | |
| Harling Daniel | $155,000 | -- | |
| Oconnor Kevin P | $128,000 | -- | |
| Oconnor Kevin P | $128,000 | -- |
Source: Public Records
Mortgage History
| Date | Status | Borrower | Loan Amount |
|---|---|---|---|
| Previous Owner | Oconnor Kevin P | $100,000 |
Source: Public Records
Tax History Compared to Growth
Tax History
| Year | Tax Paid | Tax Assessment Tax Assessment Total Assessment is a certain percentage of the fair market value that is determined by local assessors to be the total taxable value of land and additions on the property. | Land | Improvement |
|---|---|---|---|---|
| 2025 | $5,028 | $574,000 | $0 | $574,000 |
| 2024 | $4,689 | $556,900 | $0 | $556,900 |
| 2023 | $5,013 | $531,600 | $0 | $531,600 |
| 2022 | $4,964 | $505,500 | $0 | $505,500 |
| 2021 | $4,881 | $501,100 | $0 | $501,100 |
| 2020 | $3,599 | $356,300 | $0 | $356,300 |
| 2019 | $3,513 | $356,300 | $0 | $356,300 |
| 2018 | $3,133 | $309,900 | $0 | $309,900 |
| 2017 | $3,328 | $295,000 | $0 | $295,000 |
| 2016 | $3,169 | $281,700 | $0 | $281,700 |
| 2015 | $3,177 | $288,800 | $0 | $288,800 |
| 2014 | $3,159 | $280,300 | $0 | $280,300 |
Source: Public Records
Map
Nearby Homes
- 1 Doctors Run
- 63R Main St Unit 2
- 123 Main St Unit 2
- 36 Broadway Ave
- 26 Quarry Ridge Ln
- 135 A&B Main St
- 13 Rowe Point
- 2 Boulder Top
- 15 High St Unit D
- 2 Mount Pleasant St Unit 3
- 5 Marshall Ln
- 2 Wharf Rd
- 13 Pleasant St Unit 3
- 177 Main St
- 4 Norwood Ave
- 34 Mount Pleasant St
- 57 Mt Pleasant St Unit 2B
- 6 Prospect St
- 5 Allen Ave
- 4 Alpaca Ct
- 11 Forest St Unit 1
- 11 Forest St Unit 11R
- 11 Forest St Unit 2
- 7 Forest St
- 16 Forest St Unit 18
- 18 Forest St
- 18 Forest St Unit 2nd Floor
- 16-18 Forest St Unit 3
- 10 Forest St
- 19 Forest St Unit 3
- 19 Forest St Unit 2
- 19-21 Forest St
- 15 Norwood Ct
- 8 Forest St
- 12 Forest St Unit 14
- 13 Norwood Ct
- 5 Forest St
- 10 Smith Street Ct
- 11 Norwood Ct
- 21 Forest St Unit 3