11 Forest Way East Haddam, CT 06423
Estimated Value: $300,000 - $356,000
2
Beds
2
Baths
832
Sq Ft
$385/Sq Ft
Est. Value
About This Home
This home is located at 11 Forest Way, East Haddam, CT 06423 and is currently estimated at $320,253, approximately $384 per square foot. 11 Forest Way is a home with nearby schools including East Haddam Elementary School, Nathan Hale-Ray Middle School, and Nathan Hale-Ray High School.
Ownership History
Date
Name
Owned For
Owner Type
Purchase Details
Closed on
Jun 5, 2024
Sold by
Corcoran John E and Corcoran Colleen M
Bought by
John and John Colleen Corcoran
Current Estimated Value
Purchase Details
Closed on
May 16, 2016
Sold by
Stephenson Rosemary
Bought by
Corcoran John E and Corcoran Colleen M
Purchase Details
Closed on
Feb 21, 2014
Sold by
Stephenson Rosemary and Corcoran Colleen
Bought by
Quinn Thomas
Create a Home Valuation Report for This Property
The Home Valuation Report is an in-depth analysis detailing your home's value as well as a comparison with similar homes in the area
Home Values in the Area
Average Home Value in this Area
Purchase History
| Date | Buyer | Sale Price | Title Company |
|---|---|---|---|
| John | -- | None Available | |
| John | -- | None Available | |
| Corcoran John E | -- | -- | |
| Corcoran John E | -- | -- | |
| Corcoran John E | -- | -- | |
| Corcoran John E | -- | -- | |
| Corcoran Colleen M | -- | -- | |
| Quinn Thomas | -- | -- | |
| Corcoran John E | -- | -- | |
| Quinn Thomas | -- | -- |
Source: Public Records
Tax History Compared to Growth
Tax History
| Year | Tax Paid | Tax Assessment Tax Assessment Total Assessment is a certain percentage of the fair market value that is determined by local assessors to be the total taxable value of land and additions on the property. | Land | Improvement |
|---|---|---|---|---|
| 2025 | $3,763 | $134,100 | $73,900 | $60,200 |
| 2024 | $3,589 | $134,100 | $73,900 | $60,200 |
| 2023 | $3,453 | $134,100 | $73,900 | $60,200 |
| 2022 | $2,779 | $87,410 | $50,940 | $36,470 |
| 2021 | $2,661 | $87,410 | $50,940 | $36,470 |
| 2020 | $2,661 | $87,410 | $50,940 | $36,470 |
| 2019 | $2,661 | $87,410 | $50,940 | $36,470 |
| 2018 | $2,593 | $87,410 | $50,940 | $36,470 |
| 2017 | $2,417 | $81,720 | $42,450 | $39,270 |
| 2016 | $2,398 | $81,720 | $42,450 | $39,270 |
| 2015 | $2,344 | $81,720 | $42,450 | $39,270 |
| 2014 | $2,279 | $81,690 | $42,420 | $39,270 |
Source: Public Records
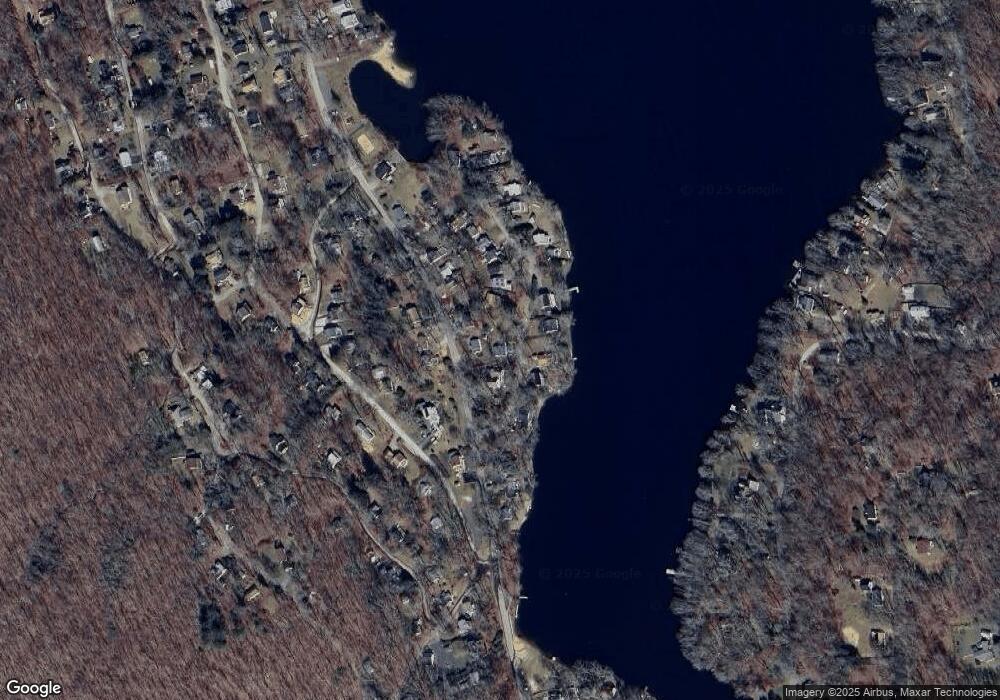
Map
Nearby Homes