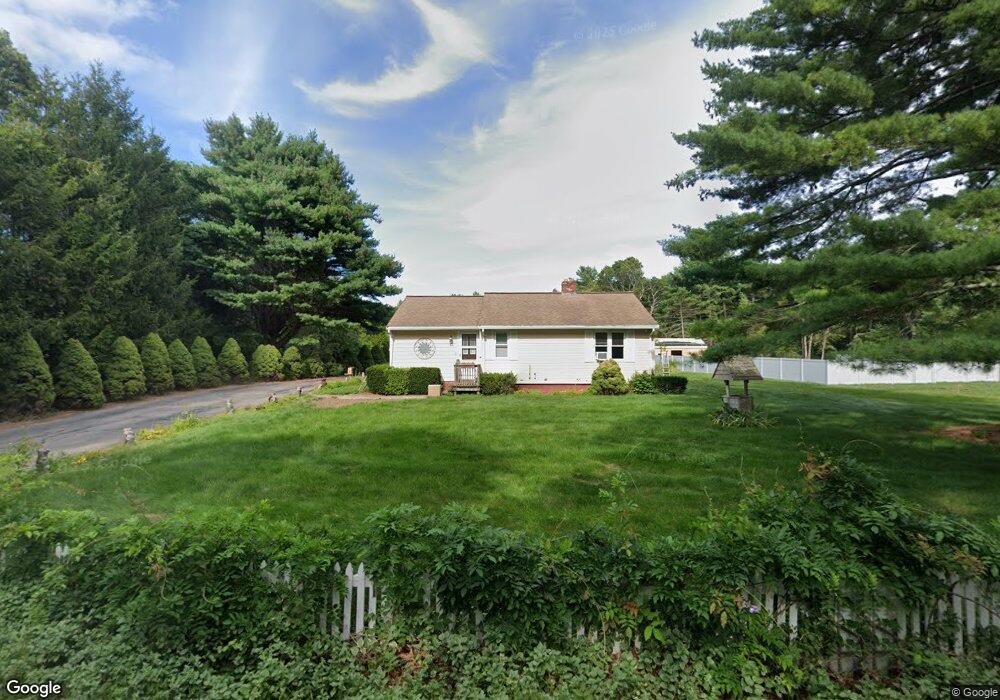
11 Forrest St Berkley, MA 02779
Estimated Value: $486,563 - $577,000
2
Beds
1
Bath
1,092
Sq Ft
$495/Sq Ft
Est. Value
About This Home
This home is located at 11 Forrest St, Berkley, MA 02779 and is currently estimated at $540,391, approximately $494 per square foot. 11 Forrest St is a home located in Bristol County with nearby schools including Berkley Community School and Our Lady of Lourdes School.
Ownership History
Date
Name
Owned For
Owner Type
Purchase Details
Closed on
Apr 30, 2004
Sold by
Frizado Dennis and Frizado Marion E
Bought by
Rea 3Rd Louis A and Rea Phyllis A
Current Estimated Value
Home Financials for this Owner
Home Financials are based on the most recent Mortgage that was taken out on this home.
Original Mortgage
$235,000
Outstanding Balance
$109,095
Interest Rate
5.36%
Mortgage Type
Commercial
Estimated Equity
$431,296
Create a Home Valuation Report for This Property
The Home Valuation Report is an in-depth analysis detailing your home's value as well as a comparison with similar homes in the area
Purchase History
We collect this data history from publicly available records. To have your information removed, we recommend requesting removal directly through your county’s website.
| Date | Buyer | Sale Price | Title Company |
|---|---|---|---|
| Rea 3Rd Louis A | $335,000 | -- |
Source: Public Records
Mortgage History
We collect this data history from publicly available records. To have your information removed, we recommend requesting removal directly through your county’s website.
| Date | Status | Borrower | Loan Amount |
|---|---|---|---|
| Open | Rea 3Rd Louis A | $235,000 |
Source: Public Records
Tax History
| Year | Tax Paid | Tax Assessment Tax Assessment Total Assessment is a certain percentage of the fair market value that is determined by local assessors to be the total taxable value of land and additions on the property. | Land | Improvement |
|---|---|---|---|---|
| 2025 | $53 | $444,300 | $163,000 | $281,300 |
| 2024 | $5,096 | $409,300 | $141,000 | $268,300 |
| 2023 | $4,942 | $373,800 | $141,000 | $232,800 |
| 2022 | $4,766 | $346,600 | $123,200 | $223,400 |
| 2021 | $4,687 | $328,200 | $117,500 | $210,700 |
| 2020 | $4,589 | $315,800 | $104,400 | $211,400 |
| 2019 | $4,519 | $308,700 | $104,400 | $204,300 |
| 2018 | $4,182 | $298,300 | $100,600 | $197,700 |
| 2017 | $4,208 | $294,300 | $112,200 | $182,100 |
| 2016 | $4,169 | $280,900 | $112,200 | $168,700 |
| 2015 | $3,945 | $283,600 | $112,200 | $171,400 |
| 2014 | $3,776 | $294,800 | $121,400 | $173,400 |
Source: Public Records
Map
Nearby Homes
Your Personal Tour Guide
Ask me questions while you tour the home.